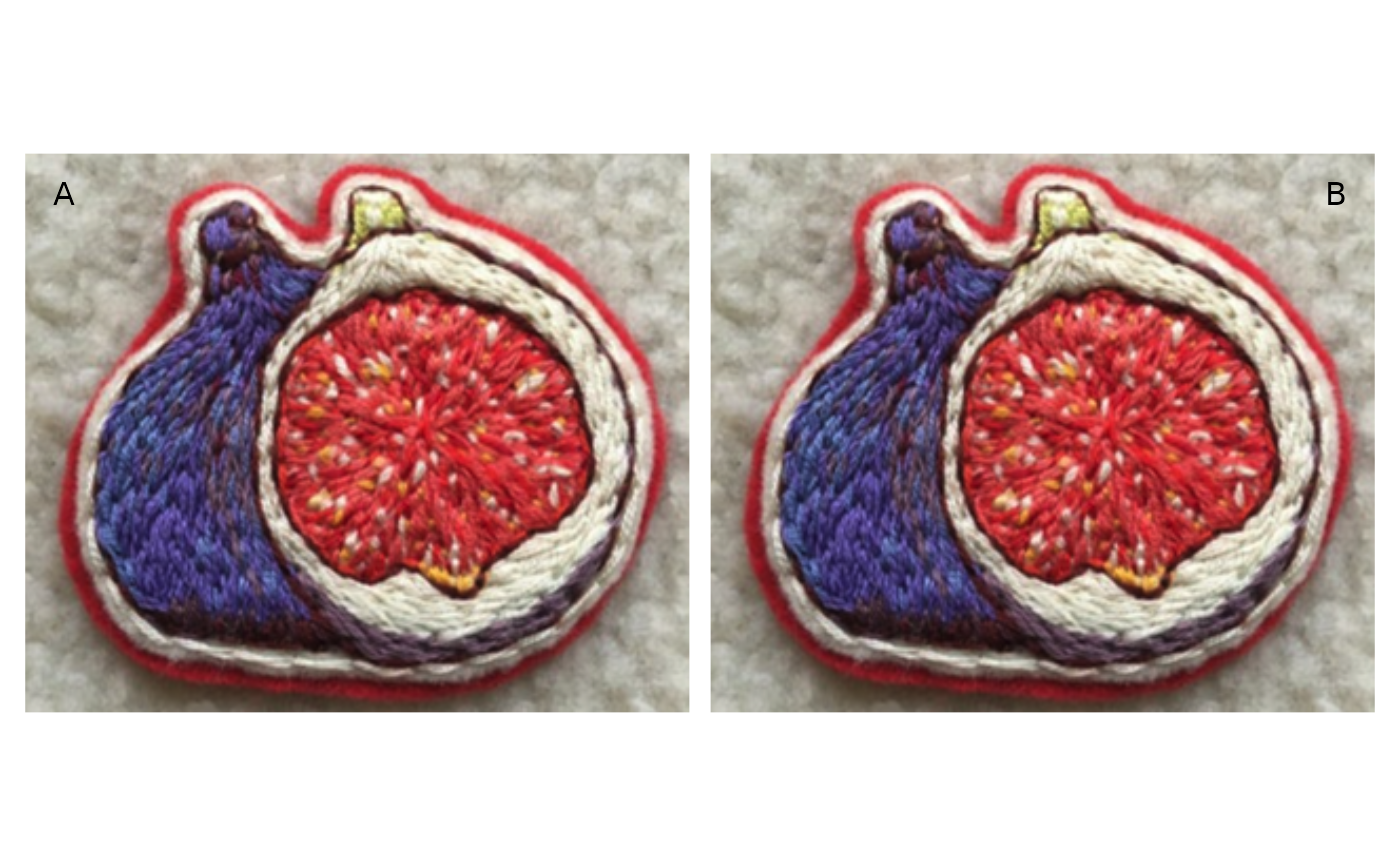
Add tags and a caption to a fig.
fig_tag(
  plot,
  tag,
  pos = "topleft",
  x_nudge = 0,
  y_nudge = 0,
  colour = NULL,
  alpha = NULL,
  hjust = NULL,
  vjust = NULL,
  fontsize = 12,
  fontface = NULL,
  fontfamily = NULL
)
Arguments
- plot
Plot from img2plot function.
- tag
Label to add to plot.
- pos
Position of label (Default 'topleft').
- x_nudge
Minor adjustments to the x position in relative plot coordindates (0 being furthest left, 1 being furthest right).
- y_nudge
Minor adjustments to the y position in relative plot coordinates (0 being the bottom, 1 being the top).
- colour
Colour of label text.
- alpha
Alpha of label text.
- hjust
hjust of plot label.
- vjust
vjust of plot label.
- fontsize
Fontsize of label (in points).
- fontface
The font face (bolt, italic, ...)
- fontfamily
Fontfamily of plot label.
Value
{ggplot2} object
Examples
library(figpatch)
library(ggplot2)

# Attach the fig image file
image <- system.file("extdata", "fig.png",
  package = "figpatch", mustWork =
    TRUE
)

# Read in the image as a 'fig'
img <- fig(image)

# Add tags on top of the figs
img1 <- fig_tag(img, "A")
img2 <- fig_tag(img, "B", pos = "topright")

# assemble the patchwork
patchwork::wrap_plots(img1, img2)
