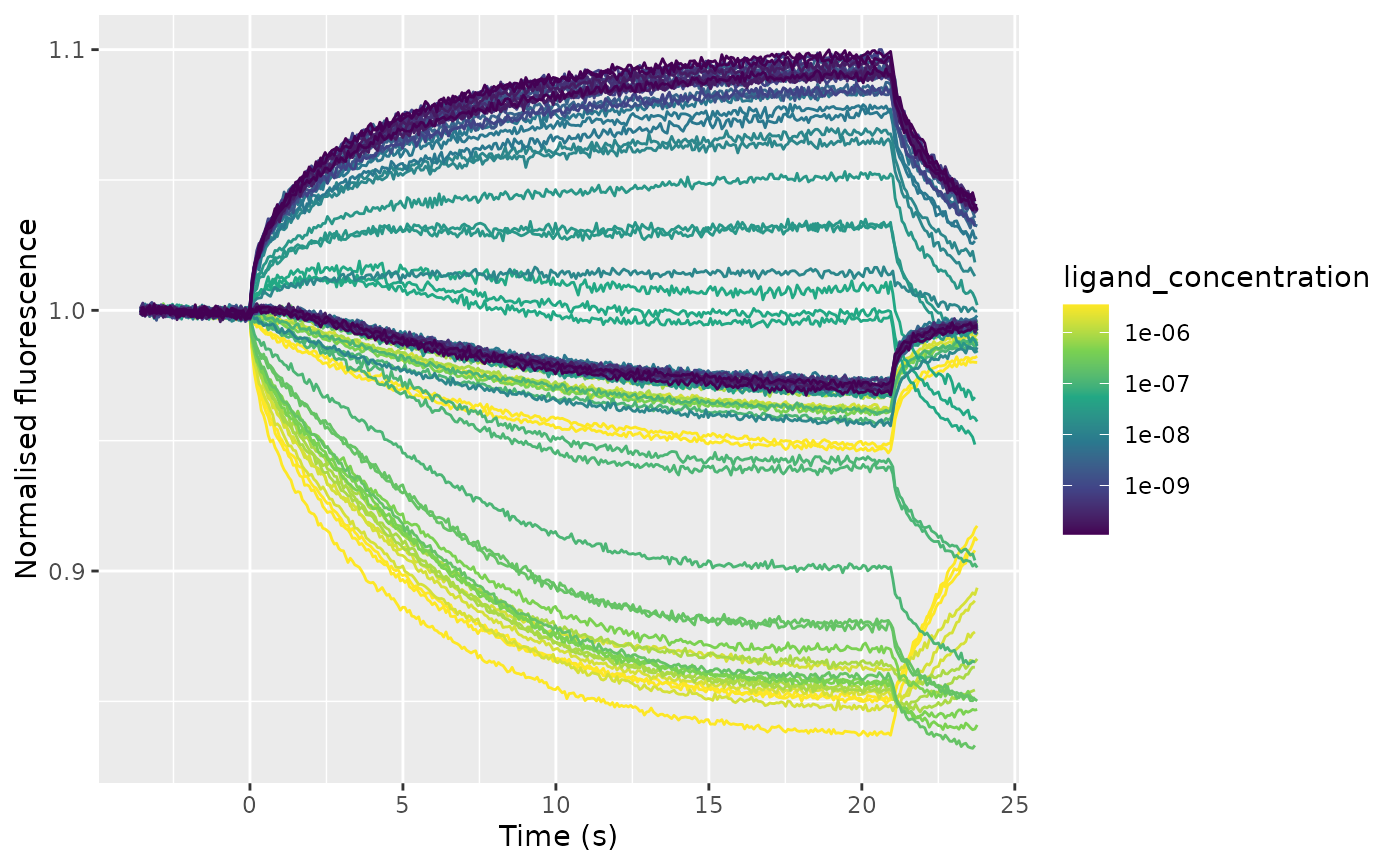
Draws one line per capillary. Requires ggplot2.
Arguments
- data
A data frame of traces, as returned by
read_mst_traces().- colour
<
data-masking> The column to colour lines by. Numeric columns are coloured on a log scale.
Examples
traces <- read_mst_traces(tidymst_example("dppr10-cy5_traces.xlsx"))
mst_plot_traces(traces)