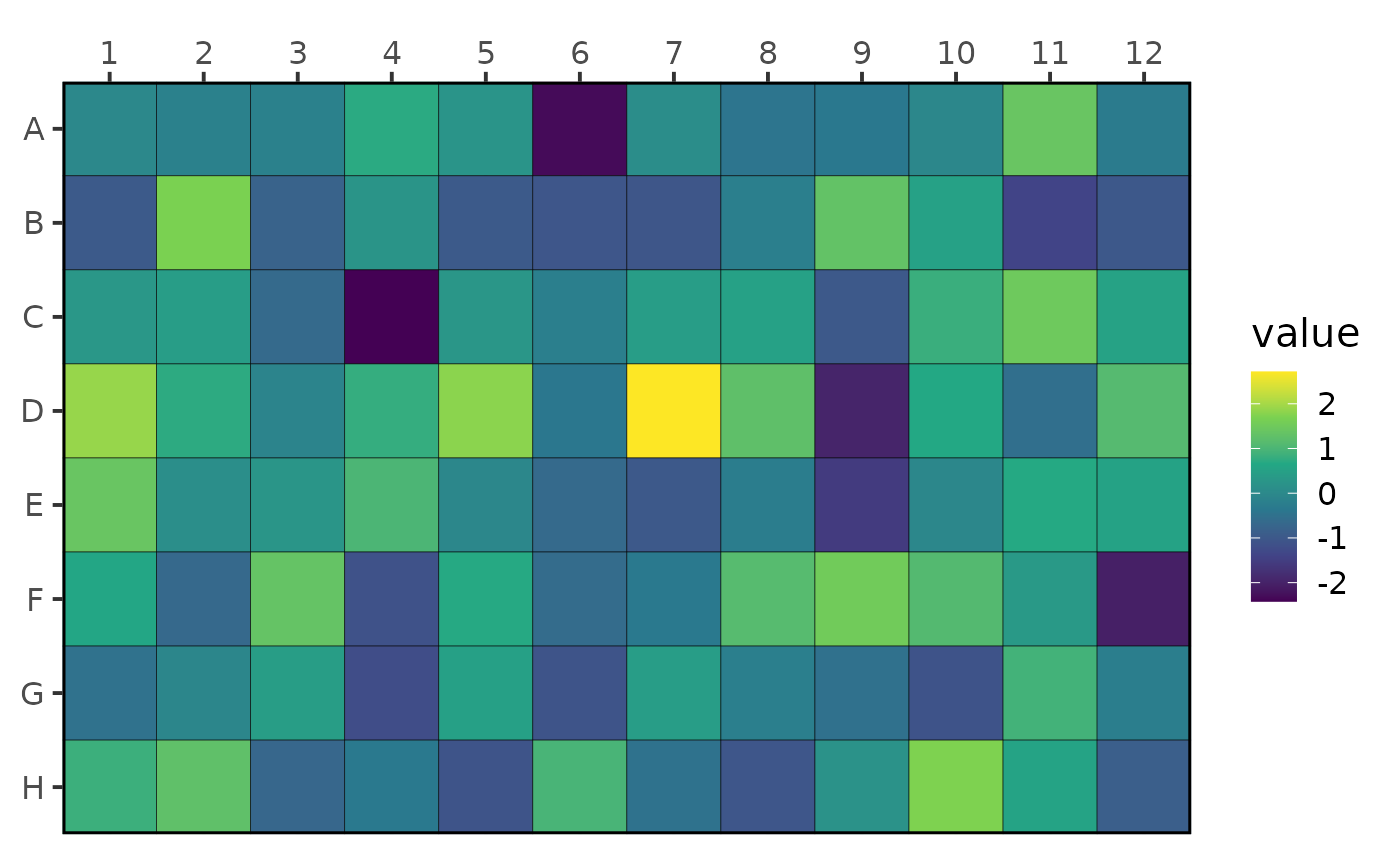
Plot a Plate Map
well_plot(data, well, value, colour = "black")Arguments
- data
Dataframe containing data.
- well
Name of the column with well IDs.
- value
Name of the column with the values to plot.
- colour
Colour of the well borders.
Value
ggplot2 object.
Examples
dat <- wellr::well_plate()[, "well"]
dat$value <- rnorm(96)
well_plot(dat, well, value)