flowchart LR
  A{Atomic\nData} --> B[Manipulation]
  B --> D(Style)
  D --> G{Geometry\nOutput}
3. Molecular Nodes
This is a very basic introduction to Molecular Nodes. How to import a protein from the PDB & change the colour and style via editing the node graph. Molecular Nodes and Geometry Nodes in general has a lot more advanced functionality, and I encourage you to watch other YouTube tutorials and spend time playing around with it to see what is possible. Everything that I have achieved so far is through playing around to see what could be done.
YouTube Tutorials
I have also made a series of YouTube tutorials walking through some of the functionality of Molecular Nodes. Currently this tutorial series is for the older version of Molecular Nodes and not the 2.0 version. The basic functionality and idea remain the same, but I will be updating this series once I get enough time.
The MolecularNodes Panel
- Click on the
Scene Propertiespanel, which will show theMolecularNodespanel, which has the buttons and options for downloading and importing protein structures. - Enter your PDB ID of choice and click on download. This will import the molecular data into Blender, and you will see a new object appear in the Outliner (top right) under the MolecularNodes collection.
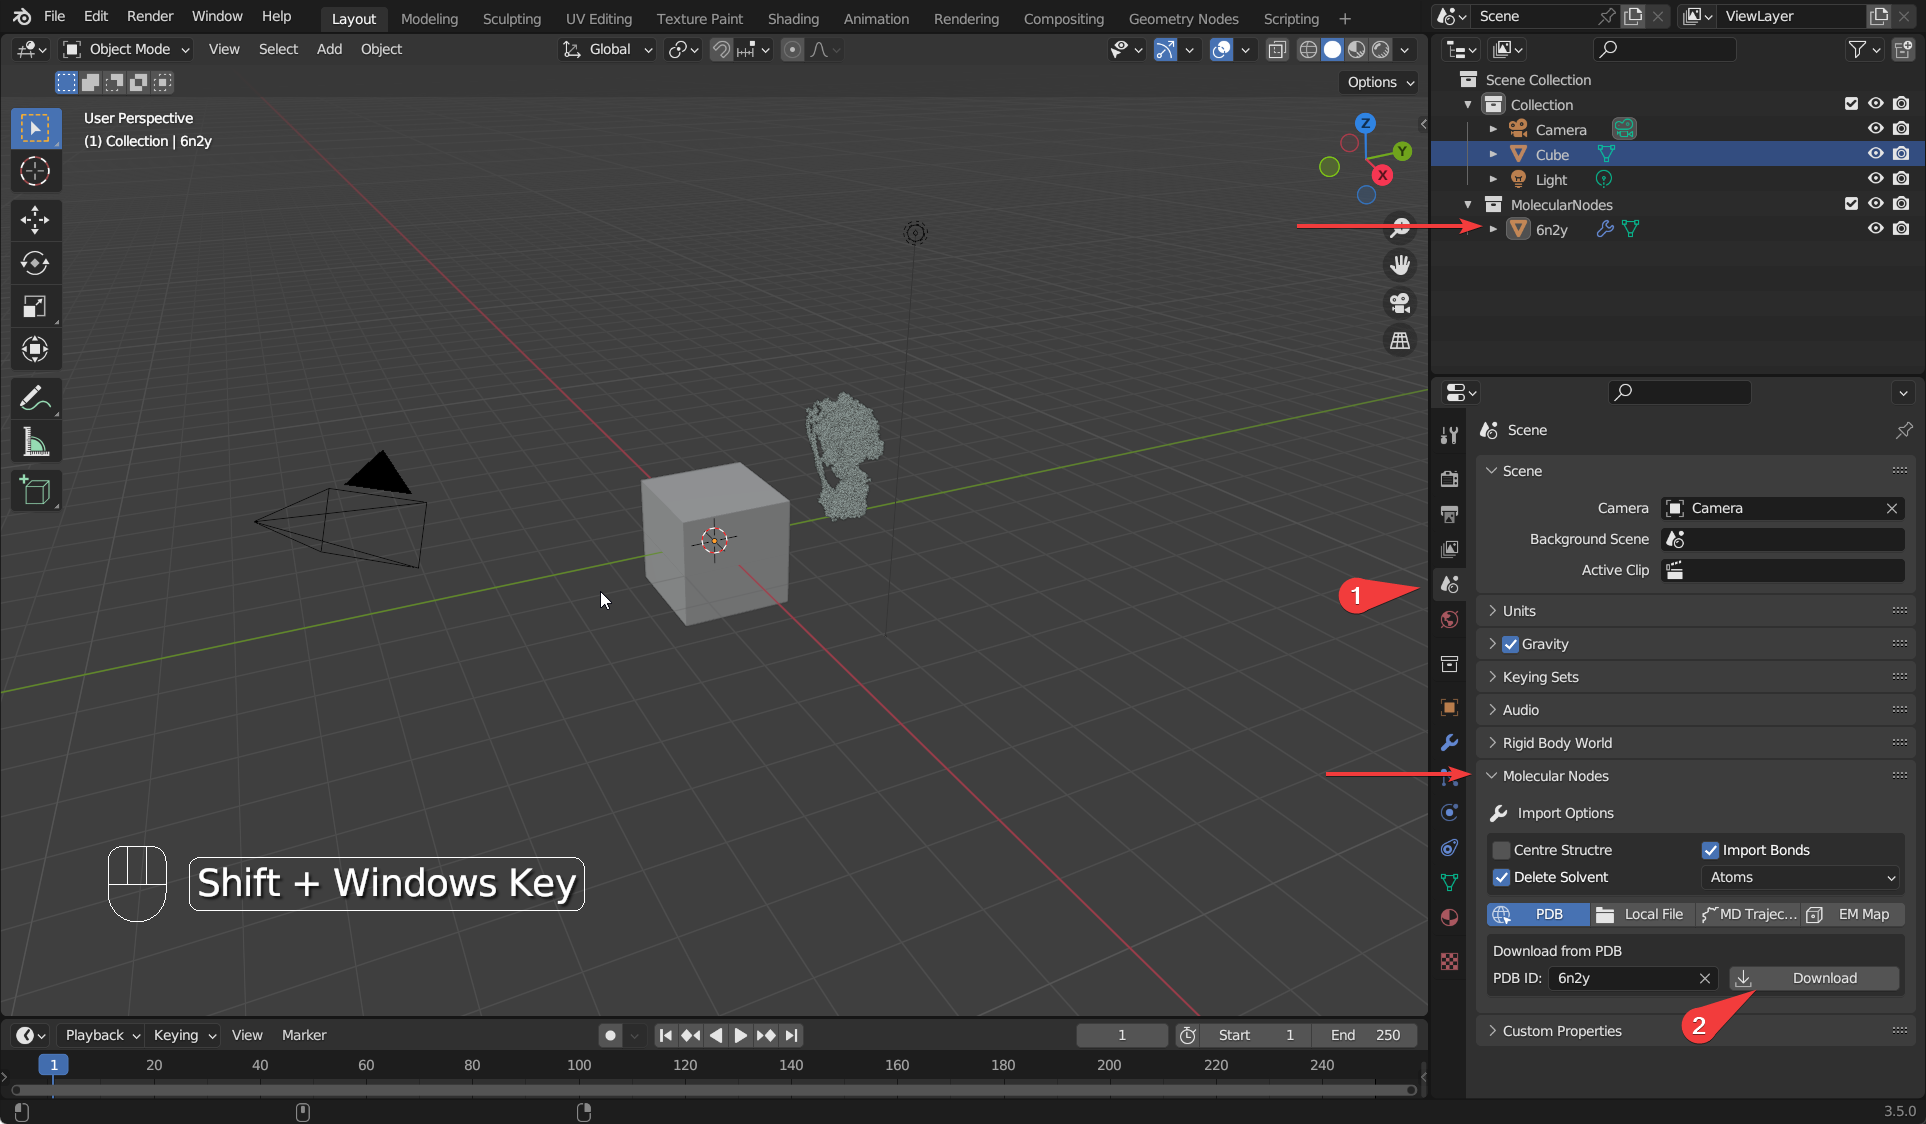
The structure is now imported into the scene. While initially the structure will appear as grey points, this is because Blender has a 3D view for working, then a Rendered view for actually rendering with calculated lighting.
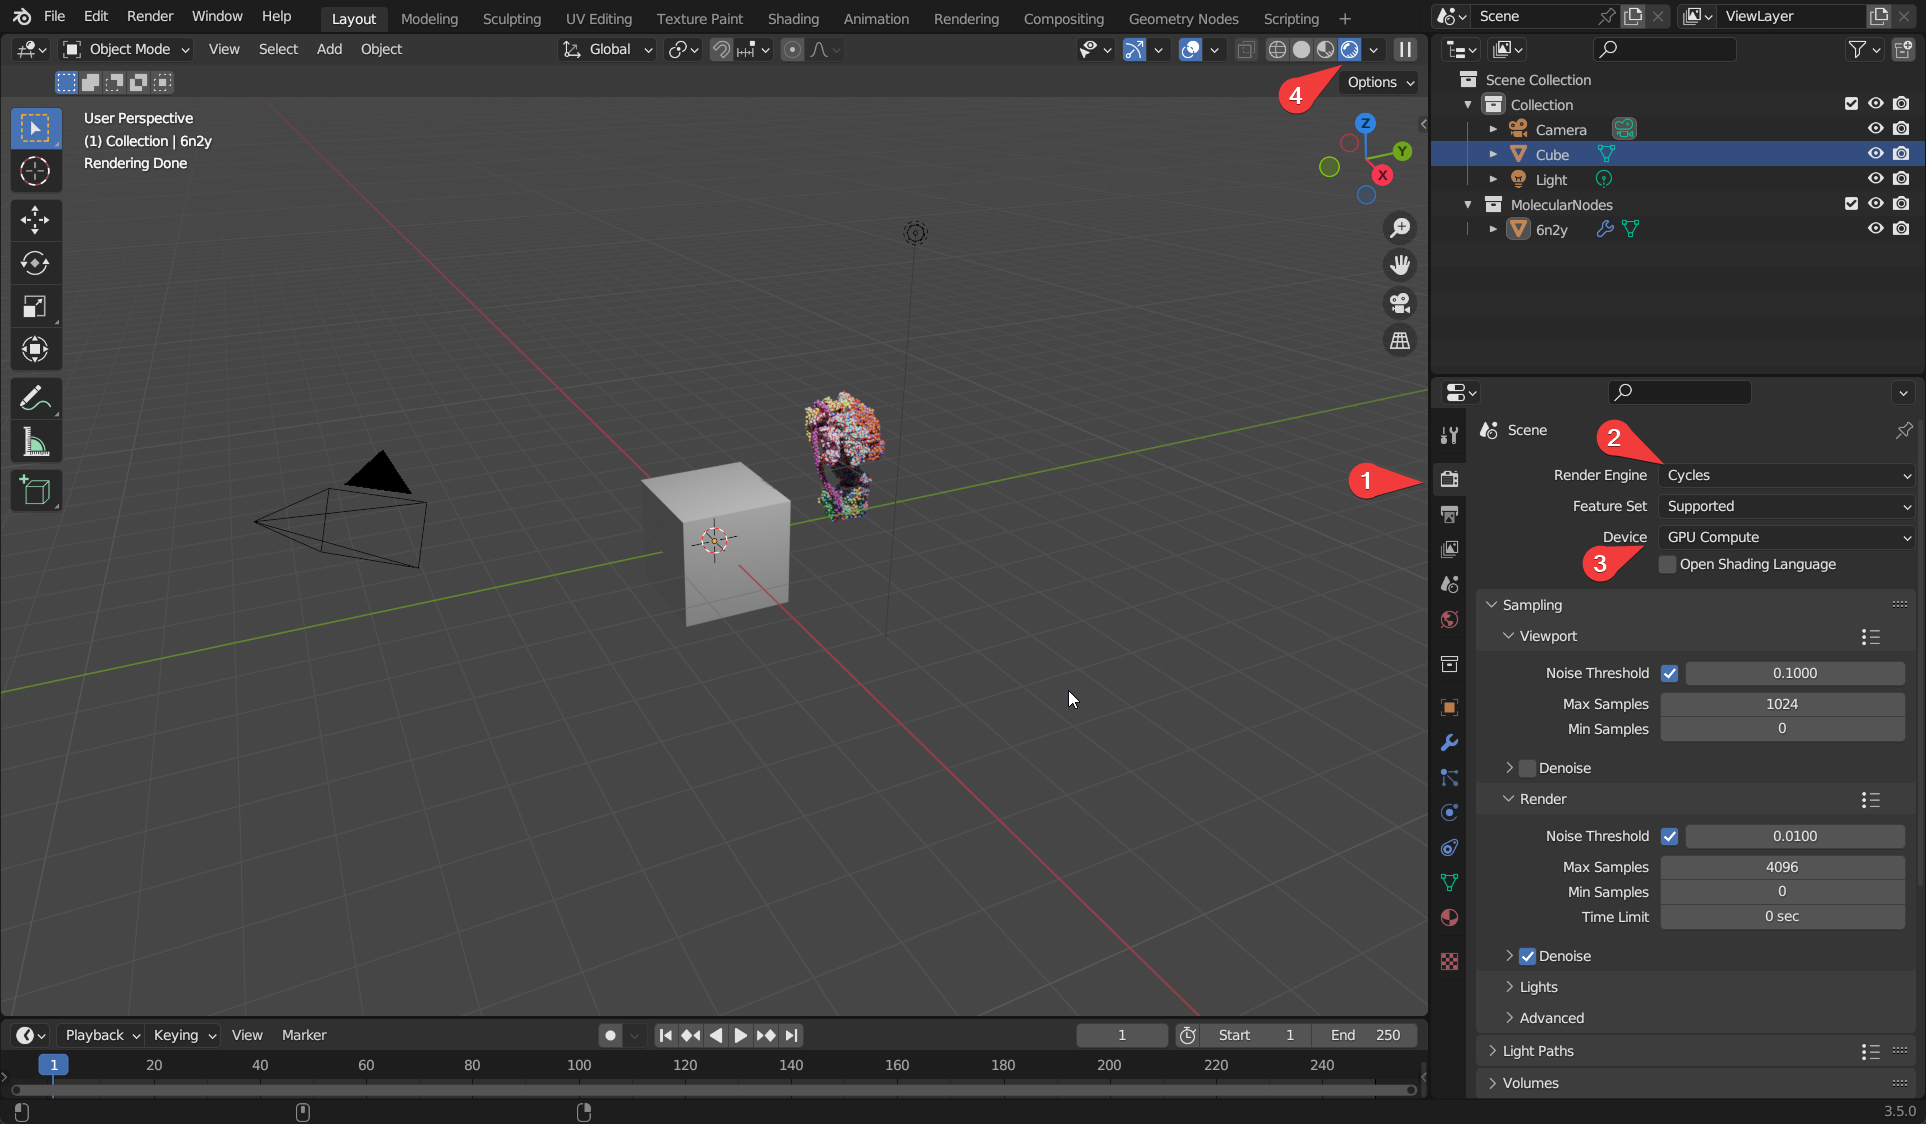
Rendered View
- Click the ‘Render Properties’ tab, which has the icon for the back of a camera.
- Change the render engine from Eevee to Cycles.
- Change the render device from CPU to GPU if applicable. Some computers may not have GPU compute available.
- Change the view to rendered view, which will calculate the lighting for the scene and show all of the atoms.
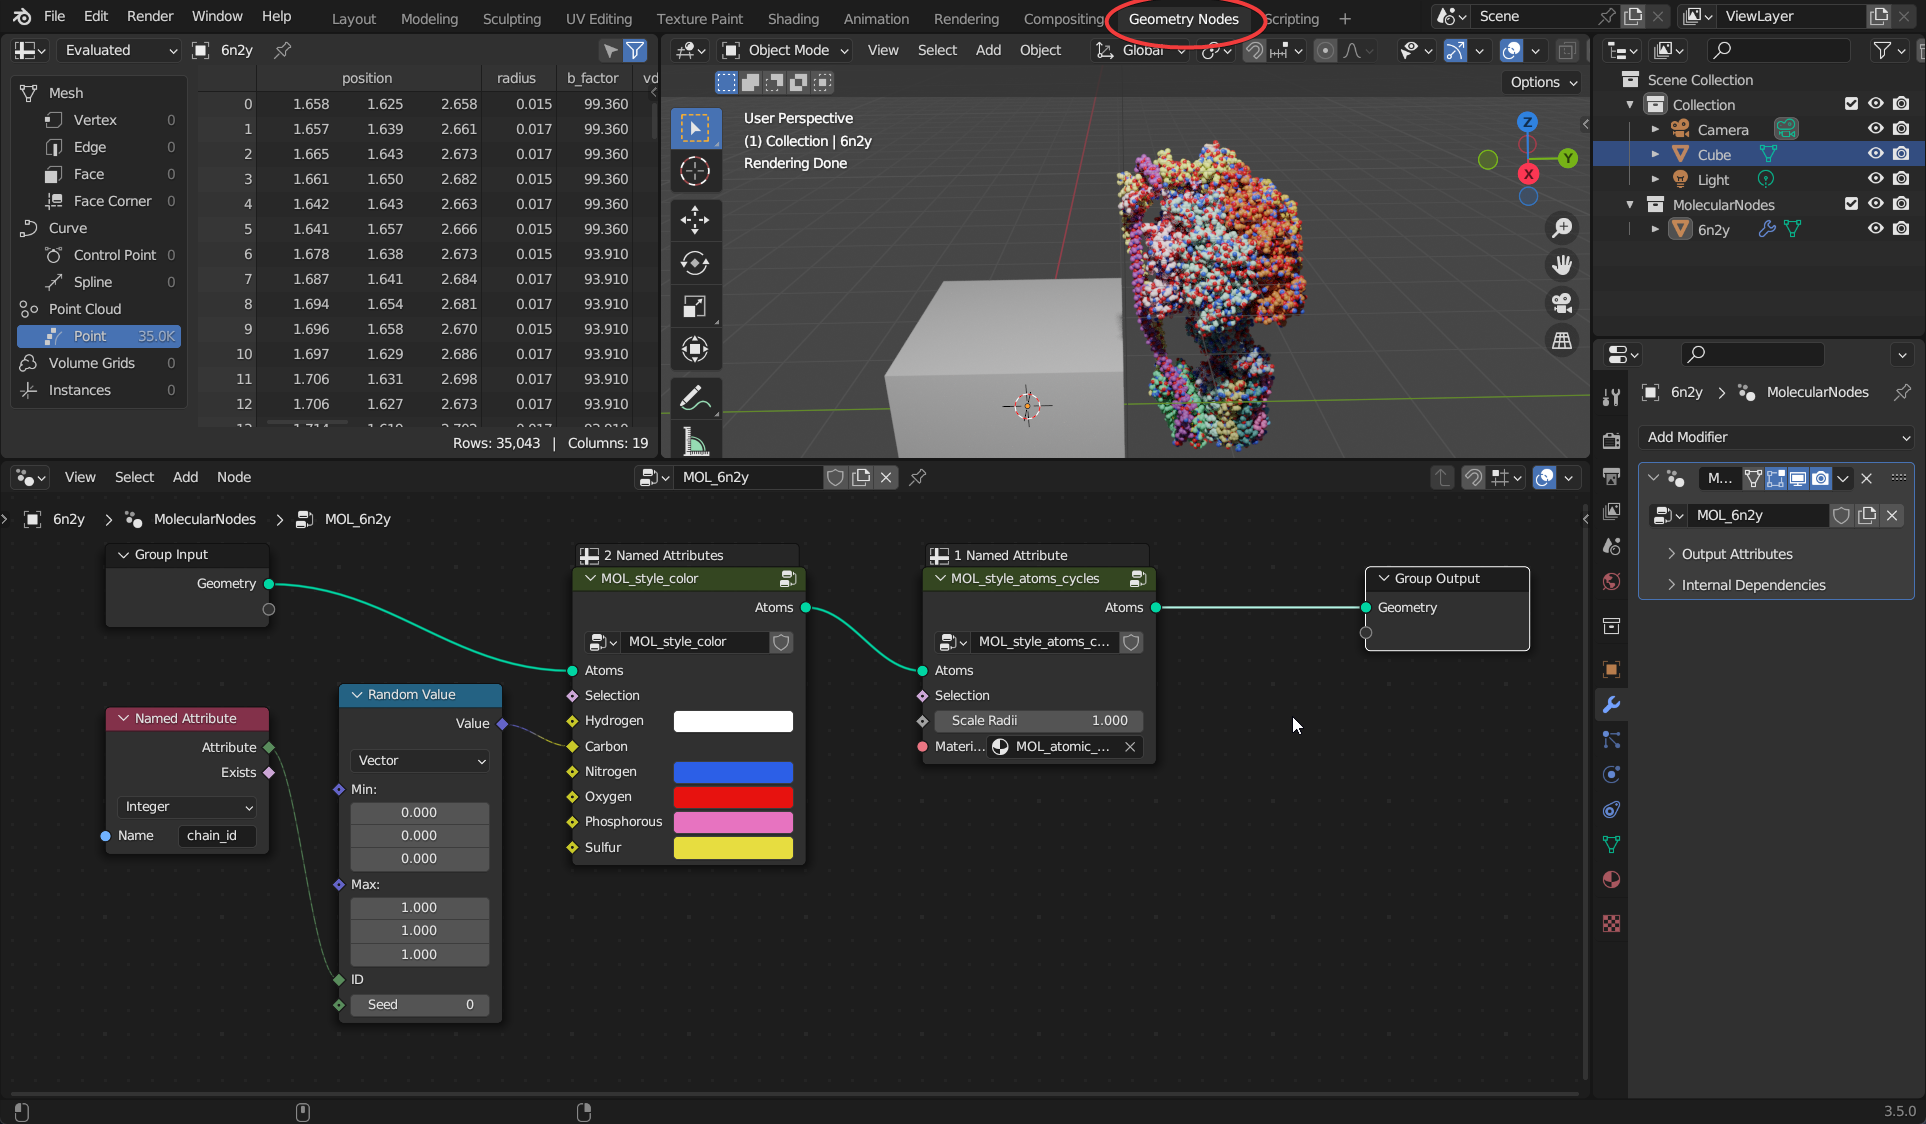
Geometry Nodes Editor
This is where we edit the node graph for Molecular Nodes. The node graph is a geometry processing program you create, that is read and executed by Blender from left to right. Each node performs an action on the geometry that is passed into it, and the result of that action is passed out to the right. Think of it as creating a set of rules for the computer to follow. You define the rules, and the computer can follow those same rules, even if you start with a different data set.
The data flows like a river, along the green noodles of the node graph. There must be only 1 final output. If you are using the molecular data, then there must also be a single input.
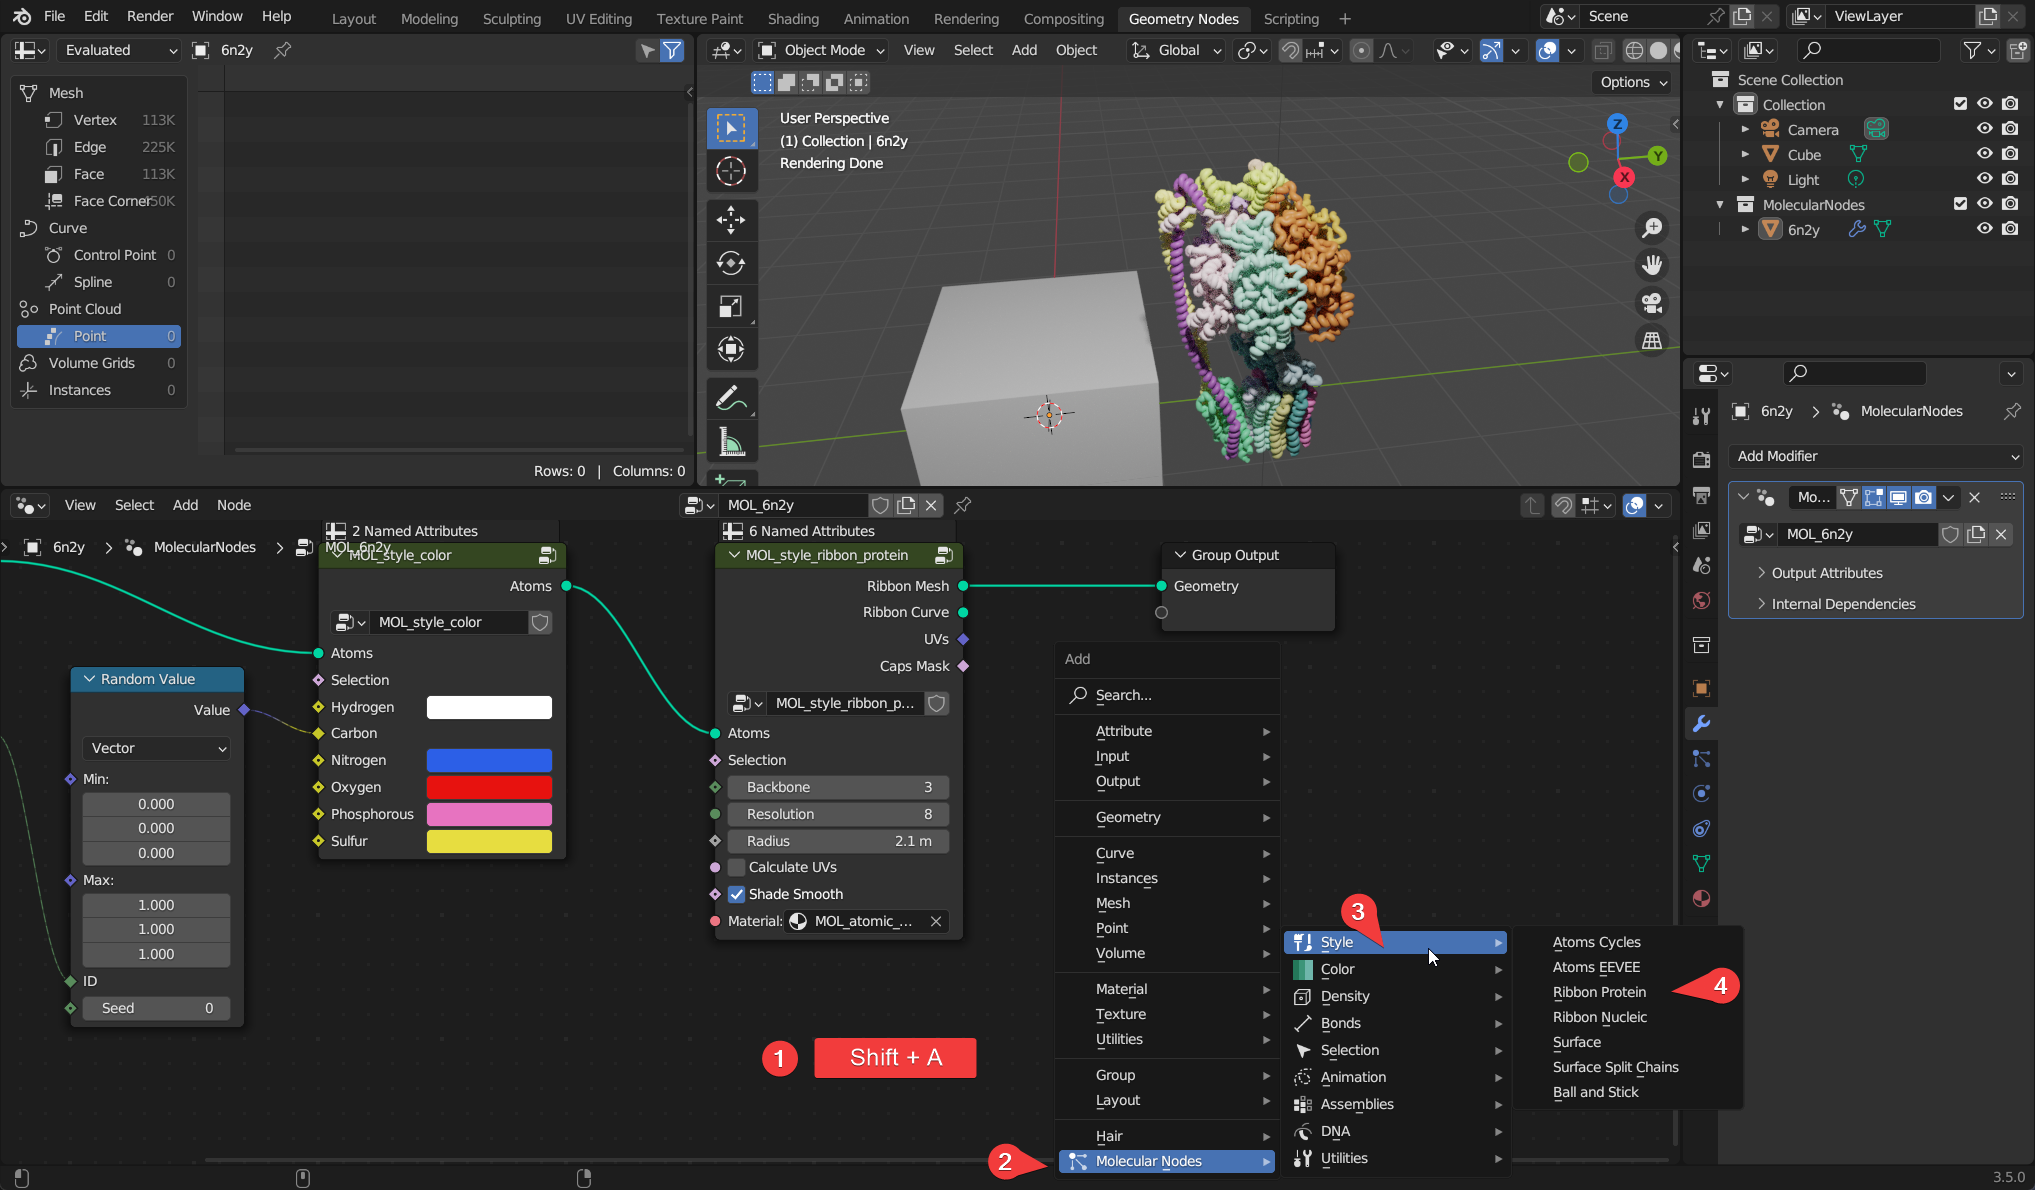
The starting style MOL_style_atoms_cycles is only visible via inside of the Cycles render engine. You can add other styles manipulate the data through other nodes, by adding them with Shift + A and navigating to the MolecularNodes panel at the bottom. There are several categories of nodes for different animations and styles. You can add the Ribbon Protein node, which will create a ribbon representation based on the alpha carbons in the structure. If there is not colour in the structure, ensure that the node has a material MOL_atomic_material at the bottom of the node.
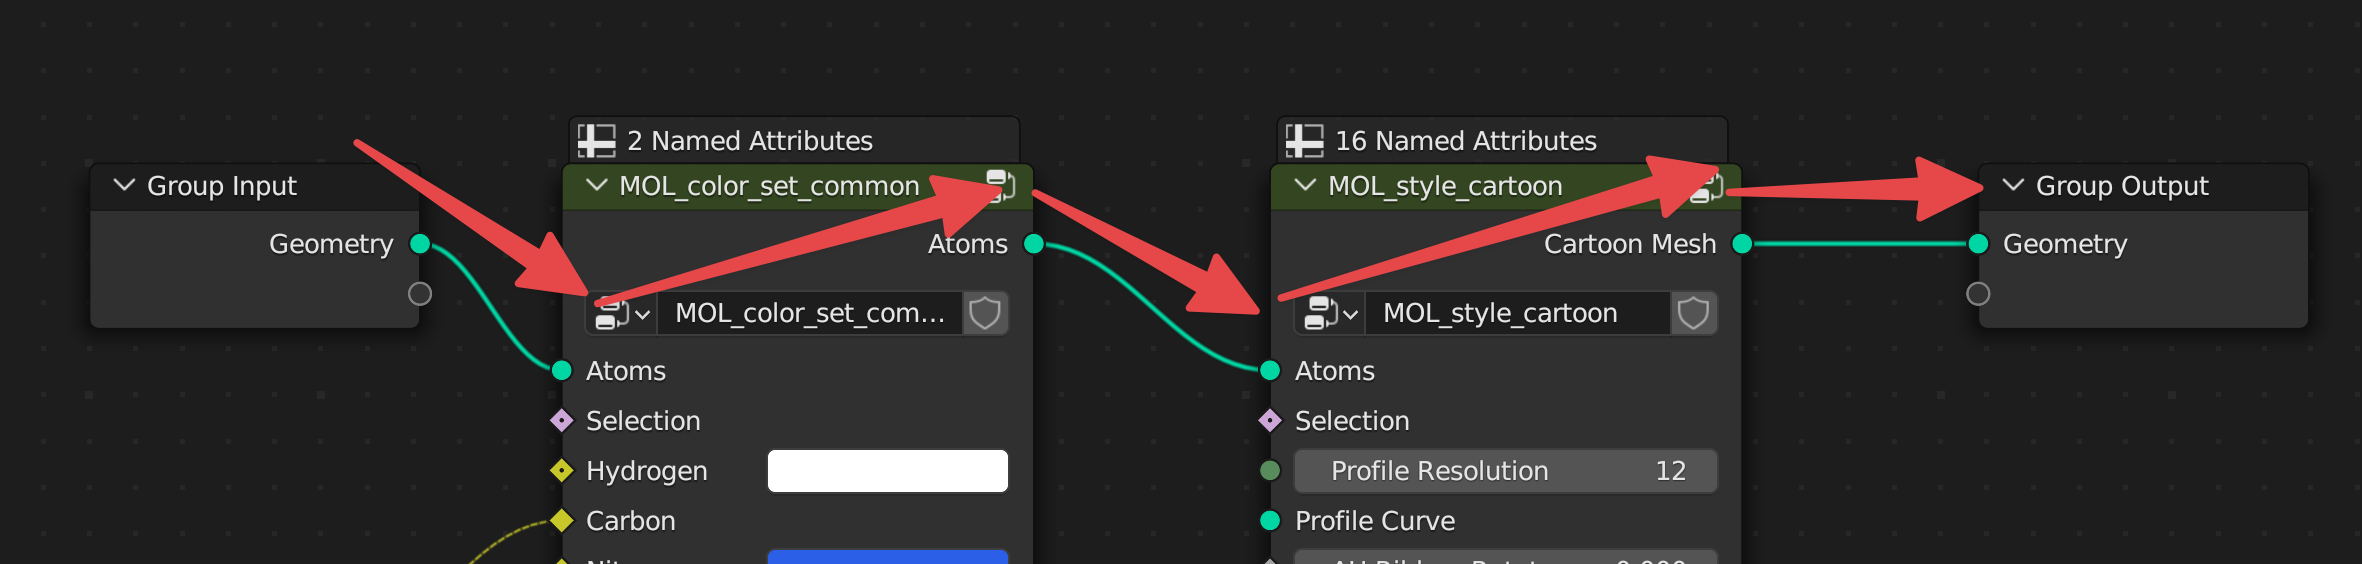
The data flows through the node graph from left to right. There should always be one input, which is the atomic data that is stored in the 3D mesh of the atoms and bonds. There should also be only one output, which is the final geometry that has been created throughout the node graph.
flowchart LR
  A{Atomic\nData} --> B[Manipulation]

  B --> D(Style 1)
  B --> E(Style 2)
  B --> S(Style 3)

  sS[Selection] --> S

  E --> F[Join\nGeometry]
  D --> F
  S --> F

  F --> G{Geometry\nOutput}
As demonstrated in the diagram, the flow of the data can split across multiple different branches of the tree, with the result of each parallel computation being combined before being exported.
Each of these different branches can be a different style, in this example shown two different styles are applied, and the third style has a custom selection. All of the styles are the result of the same data manipulation.
The node graph in between can be as complex as you want to make it, as long as there is a continuous connection to the output of the geometry, it should produce a result.

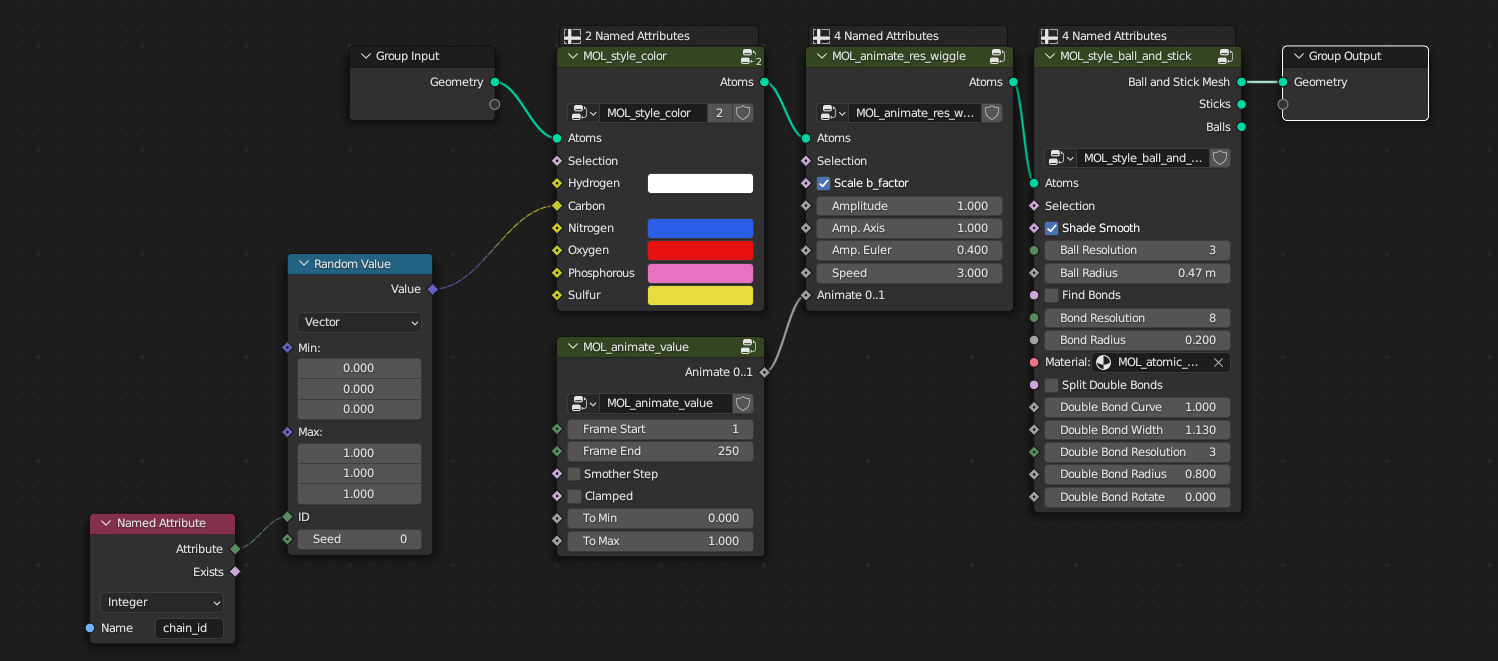
Combining multiple different nodes you can create protein models and complex 3D scenes. In the example below, there is a node tree which should be present on every new structure imported via MolecularNodes. The atoms and bonds are passed in from the left, the atoms are given a colour based on their element and their chain_id, and then the atoms are styled as atoms, scaling the atom radii to 1.00.
The data flows through the node tree from left to right, along the bright green lines. The atomic data comes in, goes through layers of manipulation, a style is applied, and the created geometry is then outputted from the node tree.
Quick Animations
There are many ways to quickly create animations inside of Blender and MolecularNodes. One such way is to use the Wiggle node inside of MolecularNodes. This wiggles the amino acid side chains, based on their experimentally-determined B-factor, to give life to the structure. Crystral structures are ultimately static snapshots of a dynamic system, and this is a quick way to bring some of those dynamics back to the structure.
In the example below, the following steps are followed:
- Import a structure from the PDB with it’s corresponding ID
- Add the
WigglenodeMolecular Nodes -> Animation -> Res Wigglein before the final style node is applied. As you change theAnimate 0..1value the AA side chains will animate. - Add the
Animate ValuenodeMolecular Nodes -> Animation -> Animate Valueand connect the output to theAnimate 0..1input of theWigglenode.
You can start and stop playback of animations in Blender with the Space key.
The resulting node tree will wiggle the AA based on the parameters as the value goes from 0 to 1. The animation will perfectly loop from values 0 to 1. Try changing the amplitude of the wiggle, or the frame range for the animate value node to see how it changes the final animation.