library(ggplot2)
library(tidyr)
library(dplyr)
#>
#> Attaching package: 'dplyr'
#> The following objects are masked from 'package:stats':
#>
#> filter, lag
#> The following objects are masked from 'package:base':
#>
#> intersect, setdiff, setequal, union
fl <- system.file(
"extdata",
"akta.asc",
package = "chromr"
)
df <- readr::read_tsv(fl, skip = 2)
#> New names:
#> • `ml` -> `ml...1`
#> • `ml` -> `ml...3`
#> Rows: 892 Columns: 4
#> ── Column specification ────────────────────────────────────────────────────────
#> Delimiter: "\t"
#> chr (1): (Fractions)
#> dbl (3): ml...1, mAU, ml...3
#>
#> ℹ Use `spec()` to retrieve the full column specification for this data.
#> ℹ Specify the column types or set `show_col_types = FALSE` to quiet this message.
head(df)
#> # A tibble: 6 × 4
#> ml...1 mAU ml...3 `(Fractions)`
#> <dbl> <dbl> <dbl> <chr>
#> 1 0 2053. 46.2 1
#> 2 0.133 2052. 48.2 2
#> 3 0.266 2052. 50.2 3
#> 4 0.4 2052. 52.2 4
#> 5 0.533 2052. 54.2 5
#> 6 0.666 2052. 56.2 6
colnames(df) <- c("ml_1", "m_au", "ml_2", "fractions")
head(df)
#> # A tibble: 6 × 4
#> ml_1 m_au ml_2 fractions
#> <dbl> <dbl> <dbl> <chr>
#> 1 0 2053. 46.2 1
#> 2 0.133 2052. 48.2 2
#> 3 0.266 2052. 50.2 3
#> 4 0.4 2052. 52.2 4
#> 5 0.533 2052. 54.2 5
#> 6 0.666 2052. 56.2 6
df_fractions <- df %>%
dplyr::select(matches("fraction") - 1, matches("fraction")) %>%
dplyr::rename(ml = 1) %>%
drop_na()
data <- df %>%
dplyr::select(
-c(matches("fraction"), matches("fraction") - 1)
) %>%
dplyr::rename(ml = 1)
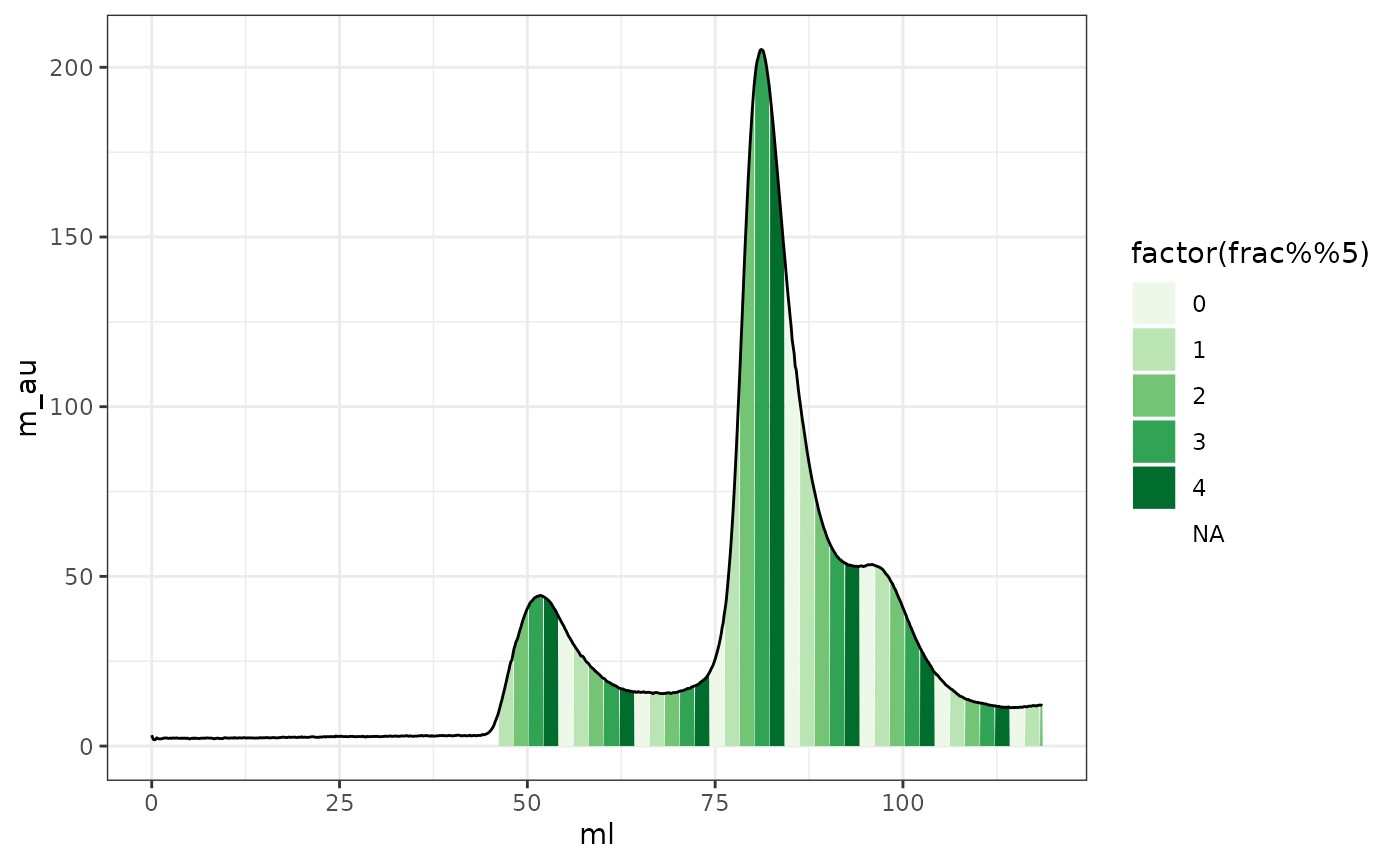
data %>%
mutate(
m_au = m_au - 2050,
frac = cut(ml, breaks = df_fractions$ml, labels = FALSE)
) %>%
ggplot(aes(ml, m_au)) +
geom_area(aes(fill = factor(frac %% 5), group = frac), na.rm = TRUE) +
geom_line() +
scale_fill_brewer(palette = 5) +
theme_bw() -> plt
plt
#> Warning: Removed 1 row containing missing values (`geom_line()`).