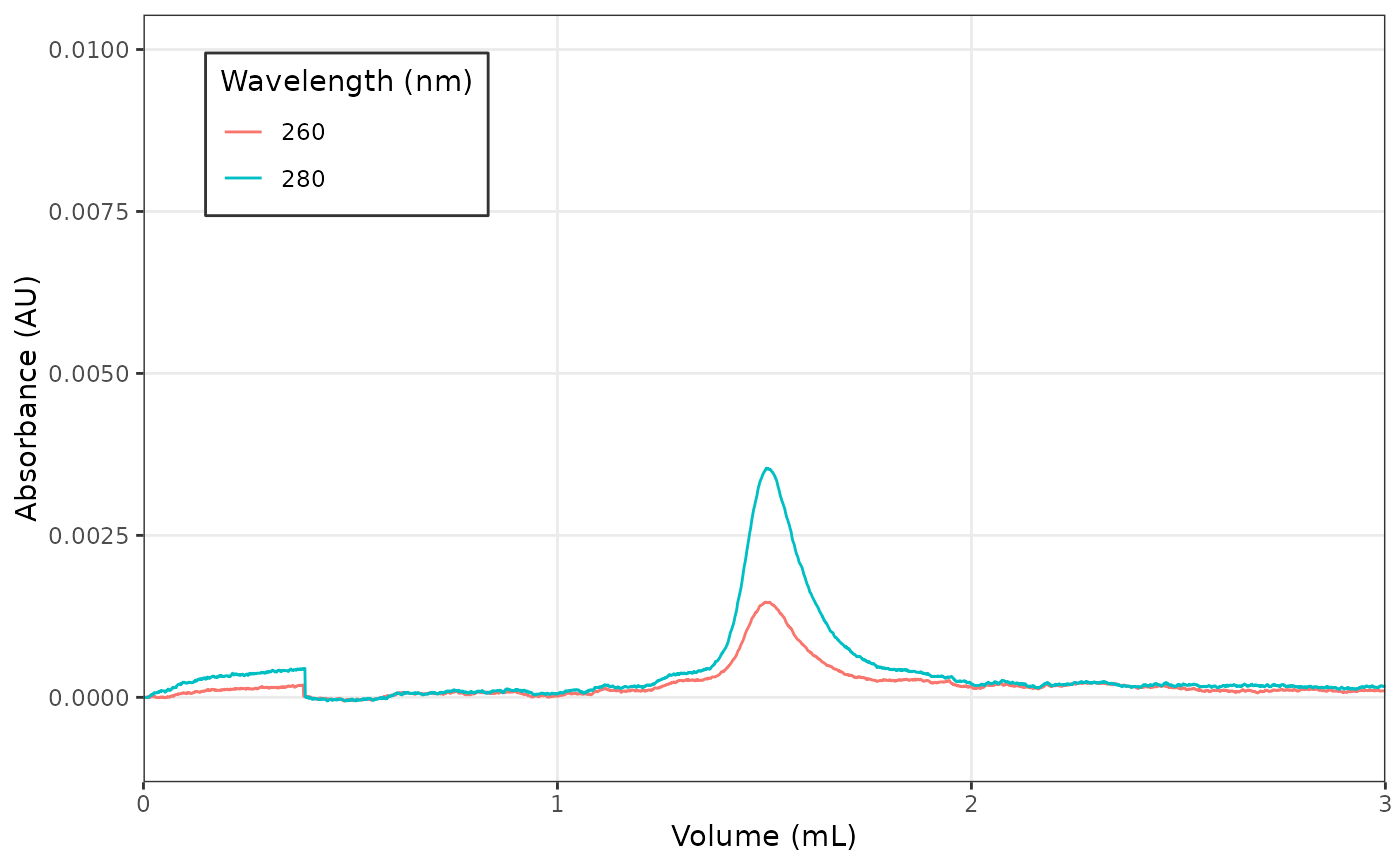
Plot a Chromatogram
chrom_plot(data, xlim = NULL, ylim = NULL)Arguments
- data
Data frame that contains columns for wavelength ('wl'), volume ('volume') and absorbance ('abs').
- xlim
Limits for the x axis.
- ylim
Limits for the y axis.
Value
a `ggplot2::ggplot()` plot.
Examples
fl <- system.file(
  "extdata",
  "sec_no_volume.txt",
  package = "chromr"
)

fl %>%
  chrom_read_quadtech() %>%
  chrom_add_volume(0.3) %>%
  chrom_plot(xlim = c(0, 3), ylim = c(NA, 0.01))