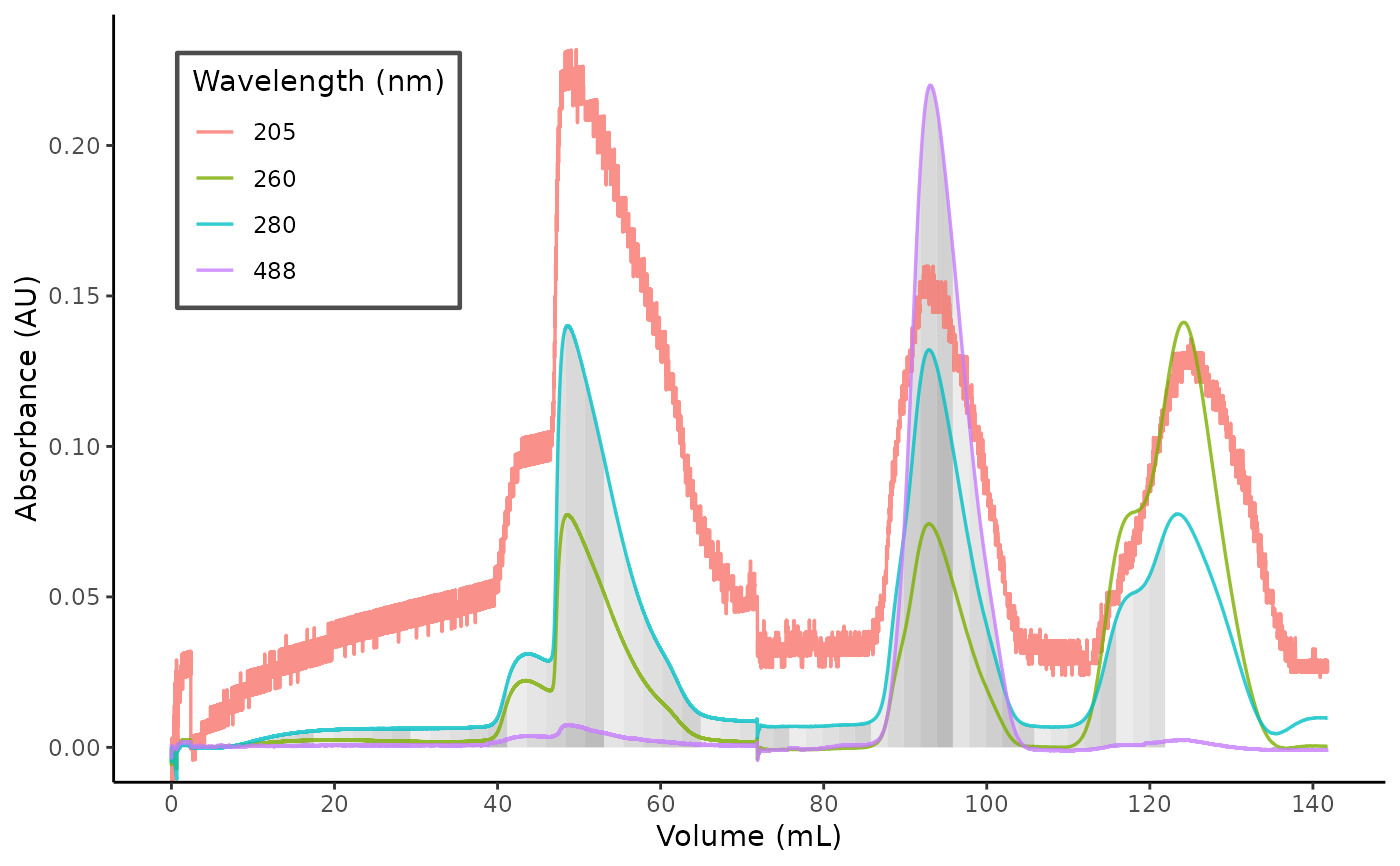
Plot Chromatogram with Fractions
chrom_plot_fractions(
  data,
  wl_frac = 280,
  fractions = TRUE,
  frac_include = "all",
  frac_labelling = 5,
  frac_text_size = 3,
  frac_text_adjust = 1.3
)
Arguments
- data
Datafram containing values.
- wl_frac
Wavelengths to show the fractionation scheme for.
- fractions
Logical, whether to incude fractions on the plot.
- frac_include
Specific fractions to include. Either "all" for all fractions, or a numeric vector of length 2, specifying the limits for the fractions to be included (e.g. c(10, 30) includes fractions from 10 till 30, including both).
- frac_labelling
How often to label the fractions. Every $n_th$ fraction is labelled.
- frac_text_size
Size of the labels for the fractionation.
- frac_text_adjust
`vjust` for the labels for the fractionation.
Value
a ggplot object.
Examples
fl1 <- system.file("extdata",
  "20220809_SFPQfl_TEVdig_S200_part1.TXT",
  package = "chromr"
)
fl2 <- system.file("extdata",
  "20220809_SFPQfl_TEVdig_S200_part2.TXT",
  package = "chromr"
)
df1 <- chrom_read_quadtech(fl1)
df2 <- chrom_read_quadtech(fl2)
dat <- chrom_append_run(df1, df2)
chrom_plot_fractions(dat, wl_frac = c(280, 488))
