Use the data from a calibration plate, where the plate is empty except for a single well with a luminescent signal, to create a deconvolution matrix that can be used to adjust other experimental results.
rl_calc_decon_matrix(
  data,
  value,
  b_noise,
  time = "time",
  ref_well = "I05",
  well = "well"
)
Arguments
- data
A data frame that contains the data of the calibration plate.
- value
Name of the column containing the luminescent values.
- b_noise
The value of the background noise, which is the average signal for the background wells that are far away from the reference well.
- time
Name of the column with the time values.
- ref_well
The well ID of the reference well (i.e. 'E05', 'I12")
- well
Name of the column with the well ID values.
Value
a deconvolution matrix, for use in rl_adjust_plate()
Details
The deconvolution matrix will be unique for each plate type and plate-reader, so a matrix should be calculated for each combination of plate and plate reader, but once this is calculated, it can be re-used to adjust future experimental results.
Examples
fl <- system.file(
"extdata",
"calibrate_tecan",
"calTecan1.xlsx",
package = "reluxr"
)
dat <- plate_read_tecan(fl)
dat
#> # A tibble: 23,040 × 5
#> cycle_nr time_s signal well value
#> <dbl> <dbl> <chr> <chr> <dbl>
#> 1 1 0 OD600 A01 0.0450
#> 2 1 0 OD600 A02 0.0452
#> 3 1 0 OD600 A03 0.0453
#> 4 1 0 OD600 A04 0.0453
#> 5 1 0 OD600 A05 0.0453
#> 6 1 0 OD600 A06 0.0452
#> 7 1 0 OD600 A07 0.0458
#> 8 1 0 OD600 A08 0.0456
#> 9 1 0 OD600 A09 0.0455
#> 10 1 0 OD600 A10 0.0451
#> # … with 23,030 more rows
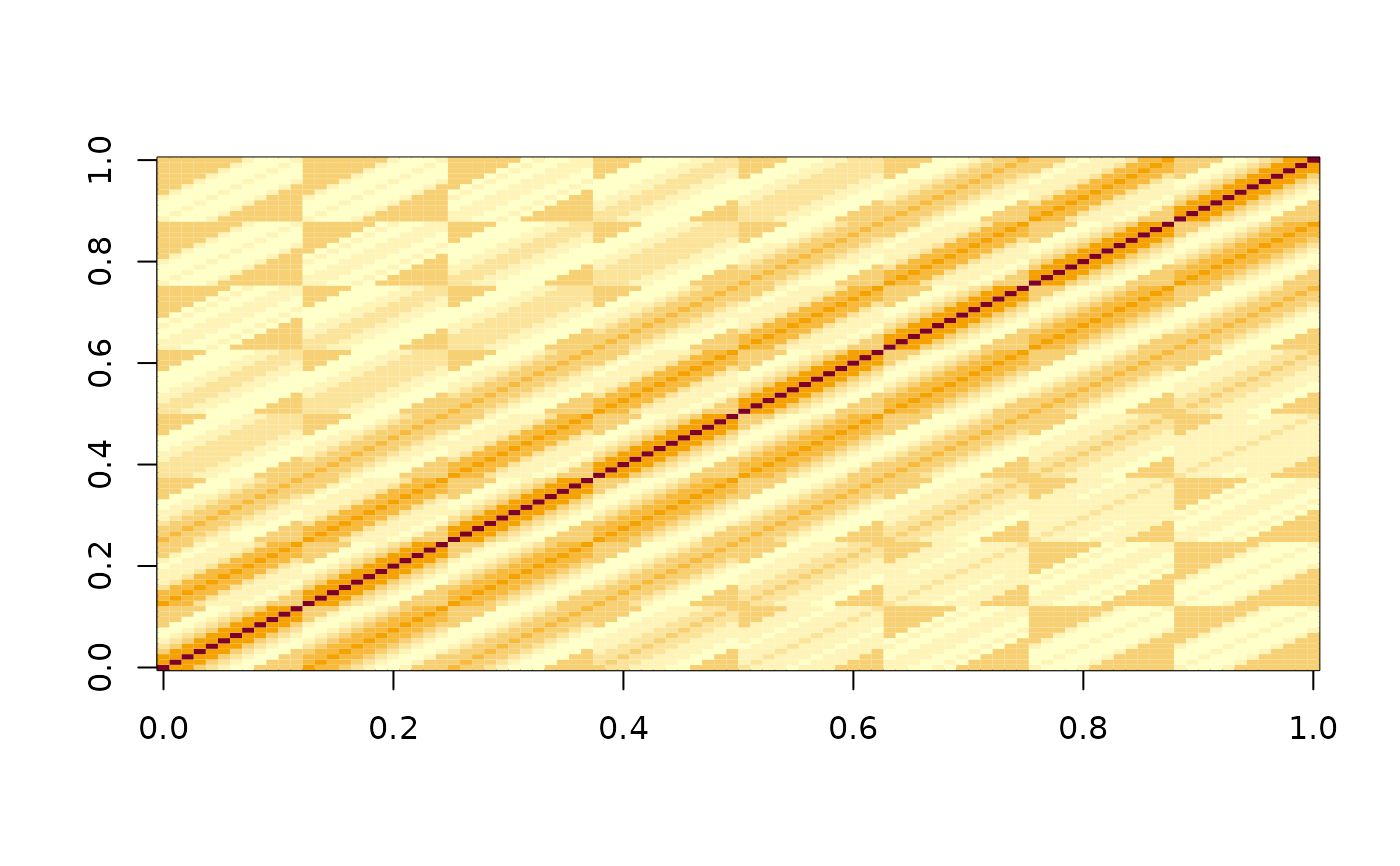
mat_d <- dat |>
dplyr::filter(signal != "OD600") |>
dplyr::filter(time_s > 500) |>
rl_calc_decon_matrix(value, time_s, ref_well = "E05", b_noise = 30)
image(log10(mat_d))