Using a deconvolution matrix, created through rl_calc_decon_matrix(),
adjust the values in the col_value column to take into account
bleed-through from surrounding wells.
rl_adjust_plate(data, value, mat_decon, time = "time", well = "well")Arguments
- data
A data frame that contains the experimental data.
- value
The name of the column containing the values (i.e. 'lum').
- mat_decon
A deconvolution matrix created through
rl_calc_decon_matrix()- time
The name of the column containing the time values (i.e. 'time')
- well
Name of the column with the well ID information.
Value
A dataframe with the specified column having been deconvoluted, using the supplied deconvolution matrix.
Examples
fl <- system.file(
"extdata",
"calibrate_tecan",
"calTecan1.xlsx",
package = "reluxr"
)
dat <- plate_read_tecan(fl)
mat_d_best <- dat |>
dplyr::filter(signal != "OD600") |>
dplyr::filter(time_s > 500) |>
rl_calc_decon_matrix(value, time_s, ref_well = "E05", b_noise = 30)
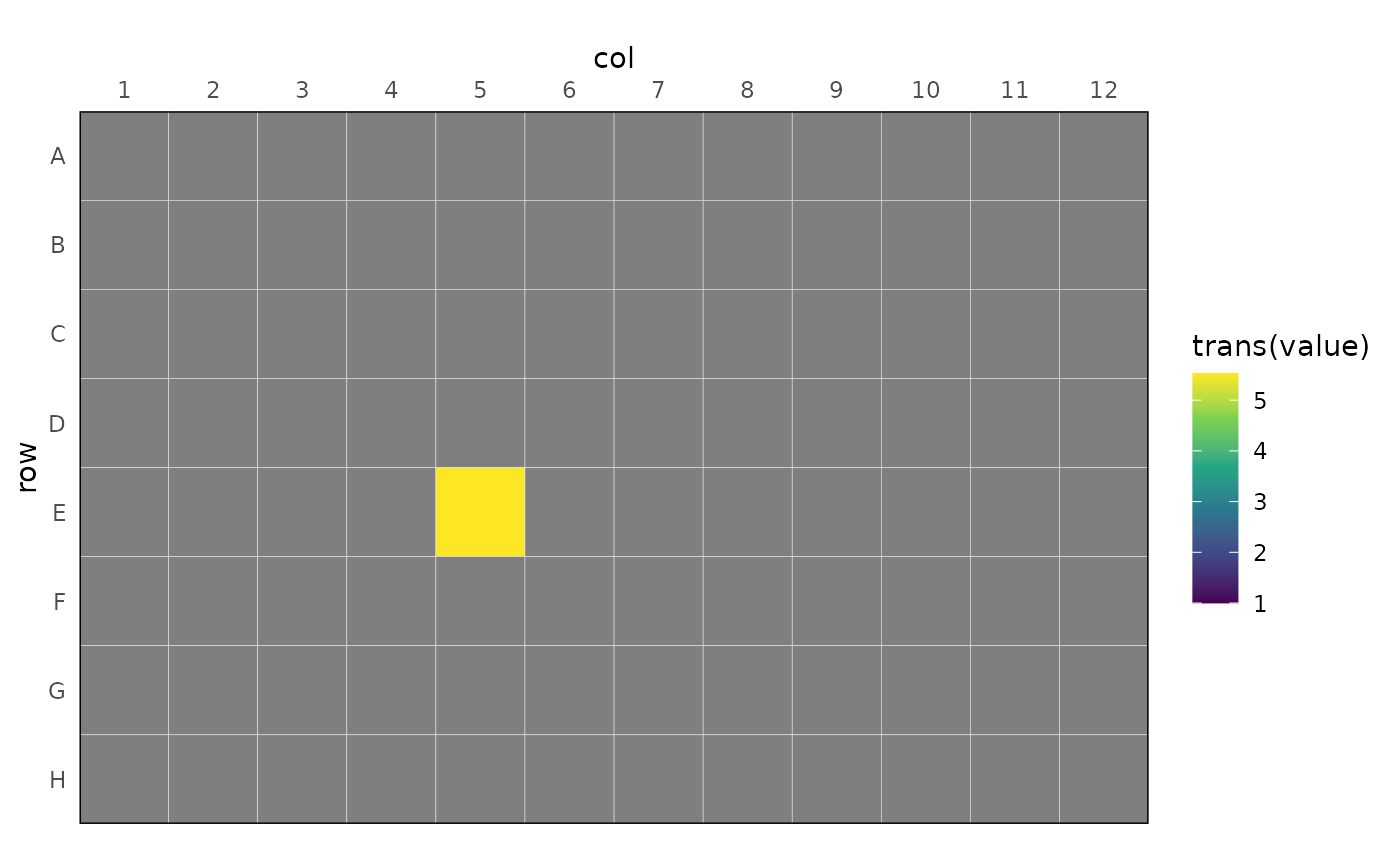
dat |>
dplyr::summarise(value = mean(value), .by = well) |>
rl_plot_plate(value, trans = log10) +
ggplot2::scale_fill_viridis_c(
limits = c(1, NA)
)
#> Scale for fill is already present.
#> Adding another scale for fill, which will replace the existing scale.
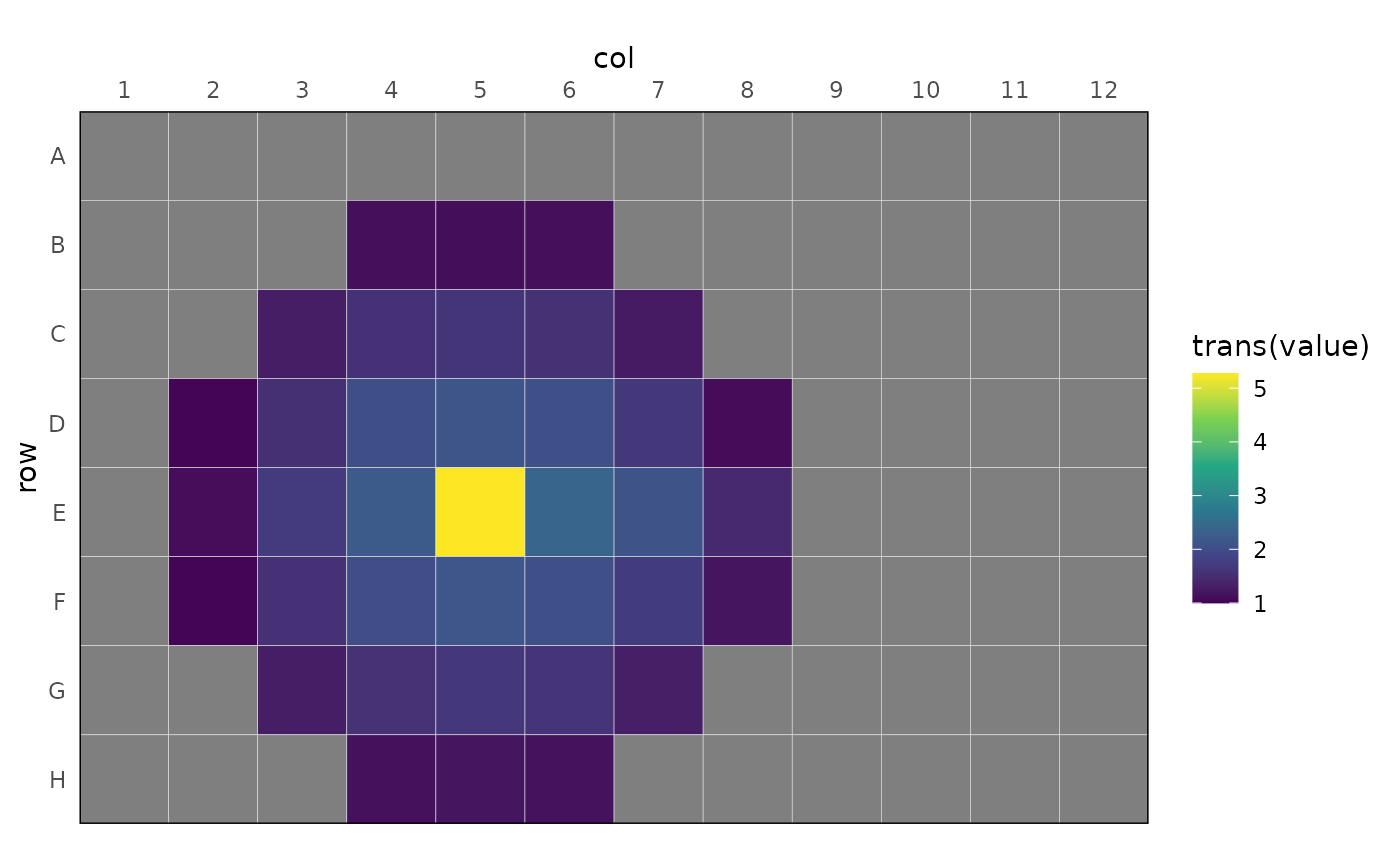 dat |>
dplyr::filter(signal == "LUMI") |>
rl_adjust_plate(value, mat_d_best, time = time_s) |>
dplyr::summarise(value = mean(value), .by = well) |>
rl_plot_plate(value, trans = log10) +
ggplot2::scale_fill_viridis_c(
limits = c(1, NA)
)
#> Scale for fill is already present.
#> Adding another scale for fill, which will replace the existing scale.
#> Warning: NaNs produced
dat |>
dplyr::filter(signal == "LUMI") |>
rl_adjust_plate(value, mat_d_best, time = time_s) |>
dplyr::summarise(value = mean(value), .by = well) |>
rl_plot_plate(value, trans = log10) +
ggplot2::scale_fill_viridis_c(
limits = c(1, NA)
)
#> Scale for fill is already present.
#> Adding another scale for fill, which will replace the existing scale.
#> Warning: NaNs produced