Use a Standard Curve to Calculate Unknown Values
std_curve_calc(std_curve, unknowns, digits = 3)Arguments
- std_curve
A linear model, created with either
lm()orstandard::std_curve_fit()- unknowns
A numeric vector of unknown values, which the standard curve will be used to predict their values.
- digits
Number of decimal places for calculations.
Value
a tibble with a column for the unknown
values, and a column .fitted for the predicted values, based on the
standard curve.
Examples
library(standard)
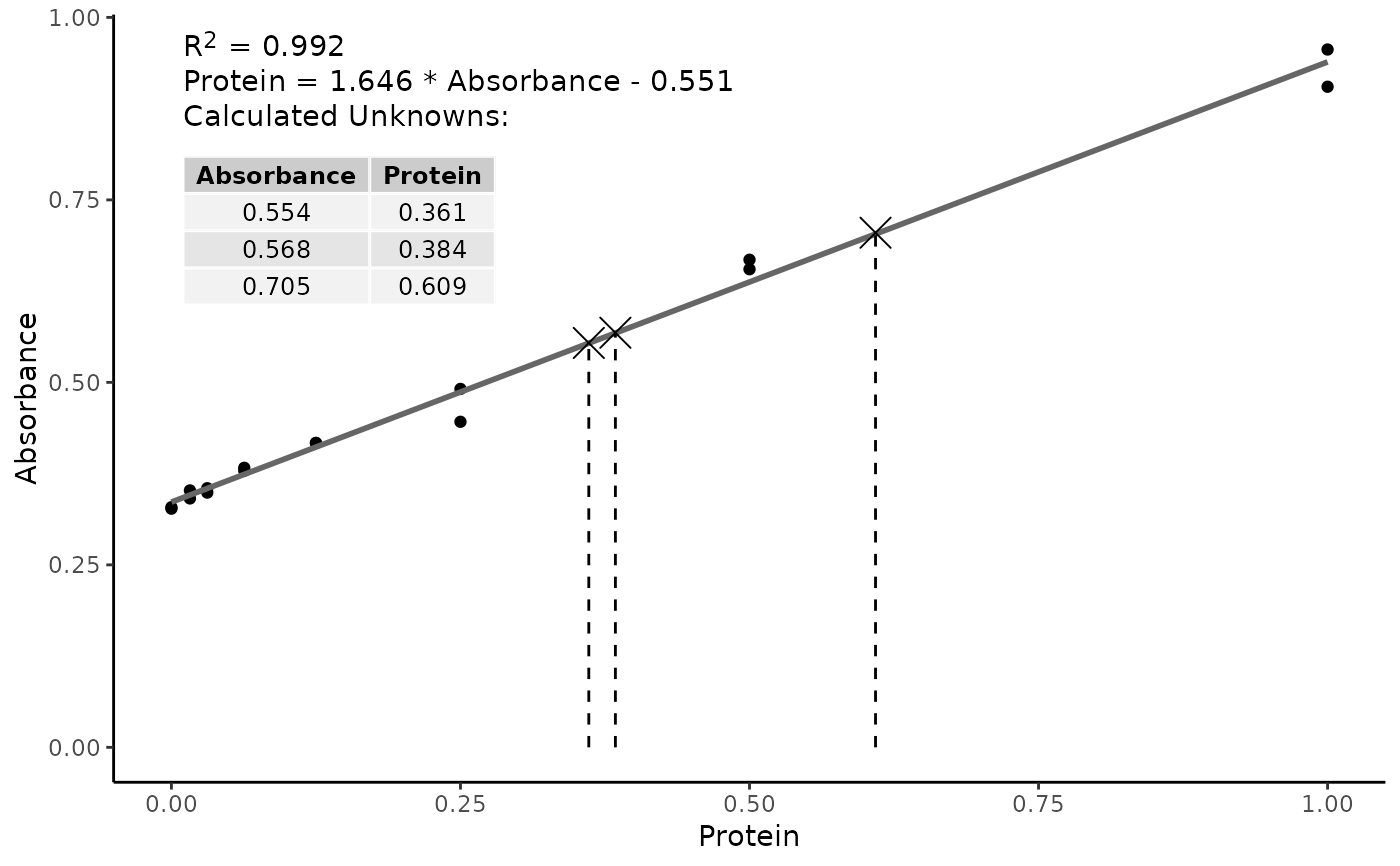
# Protein concentrations of the standards used in the assay
prot <- c(
0.000, 0.016, 0.031, 0.063, 0.125, 0.250, 0.500, 1.000,
0.000, 0.016, 0.031, 0.063, 0.125, 0.250, 0.500, 1.000
)
# absorbance readins from the standards used in the assay
abs <- c(
0.329, 0.352, 0.349, 0.379, 0.417, 0.491, 0.668, 0.956,
0.327, 0.341, 0.355, 0.383, 0.417, 0.446, 0.655, 0.905
)
assay_data <- data.frame(
Protein = prot,
Absorbance = abs
)
# unknown concentrations
unk <- c(0.554, 0.568, 0.705)
assay_data |>
std_curve_fit(Protein, Absorbance) |>
std_curve_calc(unk) |>
plot()