Create a Standard Curve From Known Data
std_curve_fit(data, conc, resp)Arguments
- data
A
data.framethat contains the columns for concentration and observed response for the standard curve.- conc
Name of the column that contains the concentration for the standard curve.
- resp
Name of the column that contains the response values for the standard curve.
Value
A linear model ( lm() ) object to be used as a standard
curve, for use with standard::std_curve_calc()
Examples
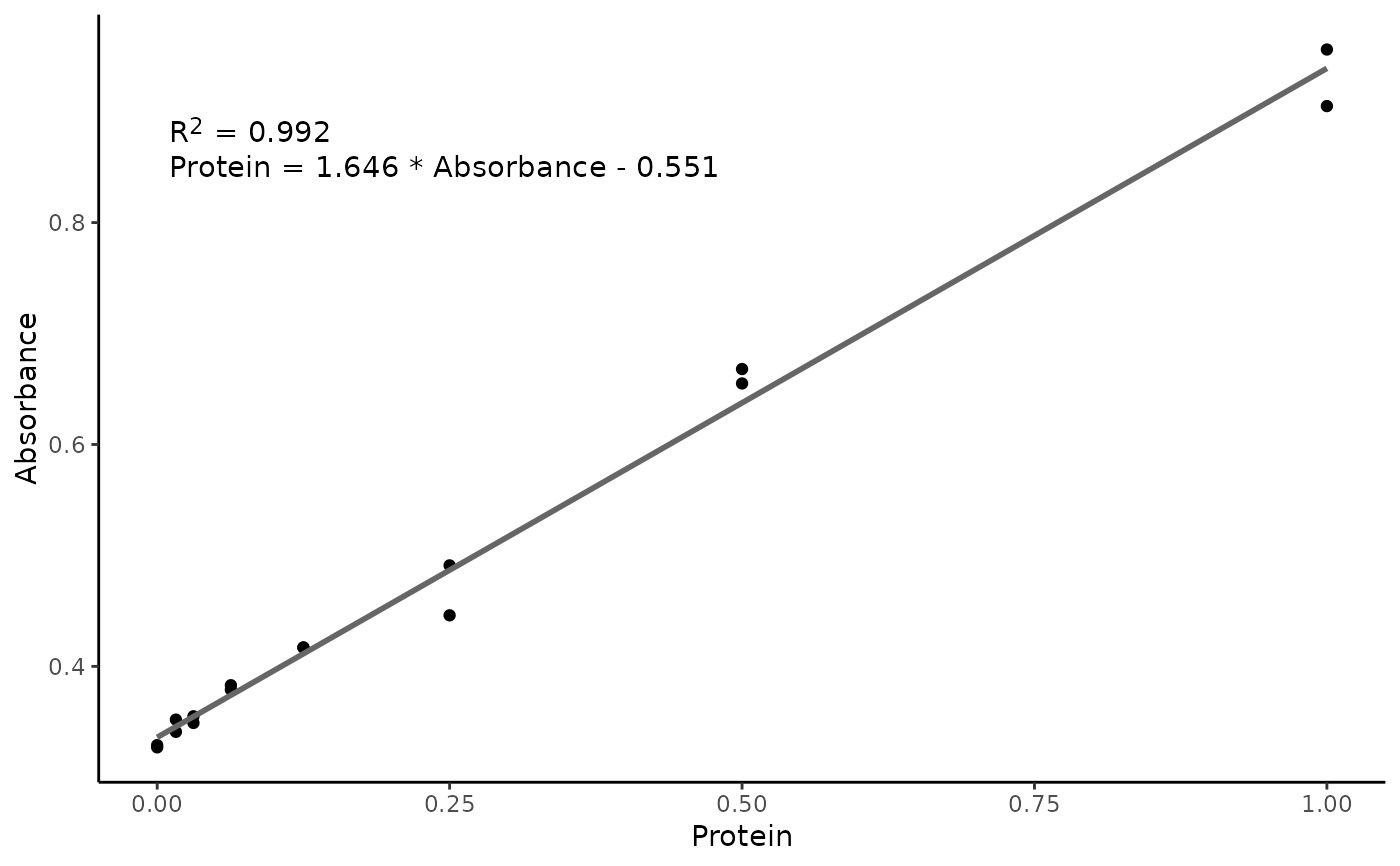
library(standard)

# Protein concentrations of the standards used in the assay
prot <- c(
  0.000, 0.016, 0.031, 0.063, 0.125, 0.250, 0.500, 1.000,
  0.000, 0.016, 0.031, 0.063, 0.125, 0.250, 0.500, 1.000
)

# absorbance readings from the standards used in the assay
abs <- c(
  0.329, 0.352, 0.349, 0.379, 0.417, 0.491, 0.668, 0.956,
  0.327, 0.341, 0.355, 0.383, 0.417, 0.446, 0.655, 0.905
)
assay_data <- data.frame(
  Protein = prot,
  Absorbance = abs
)

# unknown concentrations
unk <- c(0.554, 0.568, 0.705)


assay_data |>
  std_curve_fit(Protein, Absorbance) |>
  plot()