This function fits a Michaelis-Menton model to the dose-response data of
enzymatic reactions. By default the minimum rate is locked to 0, if you wish
to let the function find the minimum (if enzyme rate is > 0 at concentration
0) then supply the min = NA or manually set it i.e. min = 2.5.
bio_enzyme_rate(data, conc, rate, group = NULL, min = 0)Arguments
- data
Data frame with columns for concentration, reaction rate and optionally grouping information.
- conc
Column containing the concentration data.
- rate
Column containing the enzyme rate data.
- group
- min
Minimum value of enzyme rate. Defaults to 0, as if there is 0 substrate there should be no enzymatic activity in a properly blanked experiment. Set to
NAto allow the model to fit the minimum value.
Value
tibble with nested list columns of data, model, predictions,
residuals and coefficients.
Examples
# Fitting MM curves to the enzymatic data inside of datasets::Puromycin
library(bicohemr)
#> Error in library(bicohemr): there is no package called ‘bicohemr’
df <- Puromycin %>%
bio_enzyme_rate(conc, rate, state)
# the result is a tibble with a column for the data, a column for the
# calculated # model and a column for the relevant coefficients extracted from
# the model
df
#> # A tibble: 2 × 4
#> state data model coefs
#> <fct> <list> <list> <list>
#> 1 treated <tibble [12 × 2]> <drc> <tibble [2 × 5]>
#> 2 untreated <tibble [11 × 2]> <drc> <tibble [2 × 5]>
# you can extract the coefficient data using either `bio_coefs()` or
# `unnest()` on the column
bio_coefs(df)
#> # A tibble: 4 × 6
#> state term estimate std.error statistic p.value
#> <fct> <chr> <dbl> <dbl> <dbl> <dbl>
#> 1 treated Vmax 213. 7.16 29.7 4.37e-11
#> 2 treated Km 0.0641 0.00871 7.36 2.42e- 5
#> 3 untreated Vmax 160. 6.81 23.5 2.14e- 9
#> 4 untreated Km 0.0477 0.00842 5.67 3.07e- 4
tidyr::unnest(df, coefs)
#> # A tibble: 4 × 8
#> state data model term estimate std.error statistic p.value
#> <fct> <list> <list> <chr> <dbl> <dbl> <dbl> <dbl>
#> 1 treated <tibble [12 × 2]> <drc> Vmax 213. 7.16 29.7 4.37e-11
#> 2 treated <tibble [12 × 2]> <drc> Km 0.0641 0.00871 7.36 2.42e- 5
#> 3 untreated <tibble [11 × 2]> <drc> Vmax 160. 6.81 23.5 2.14e- 9
#> 4 untreated <tibble [11 × 2]> <drc> Km 0.0477 0.00842 5.67 3.07e- 4
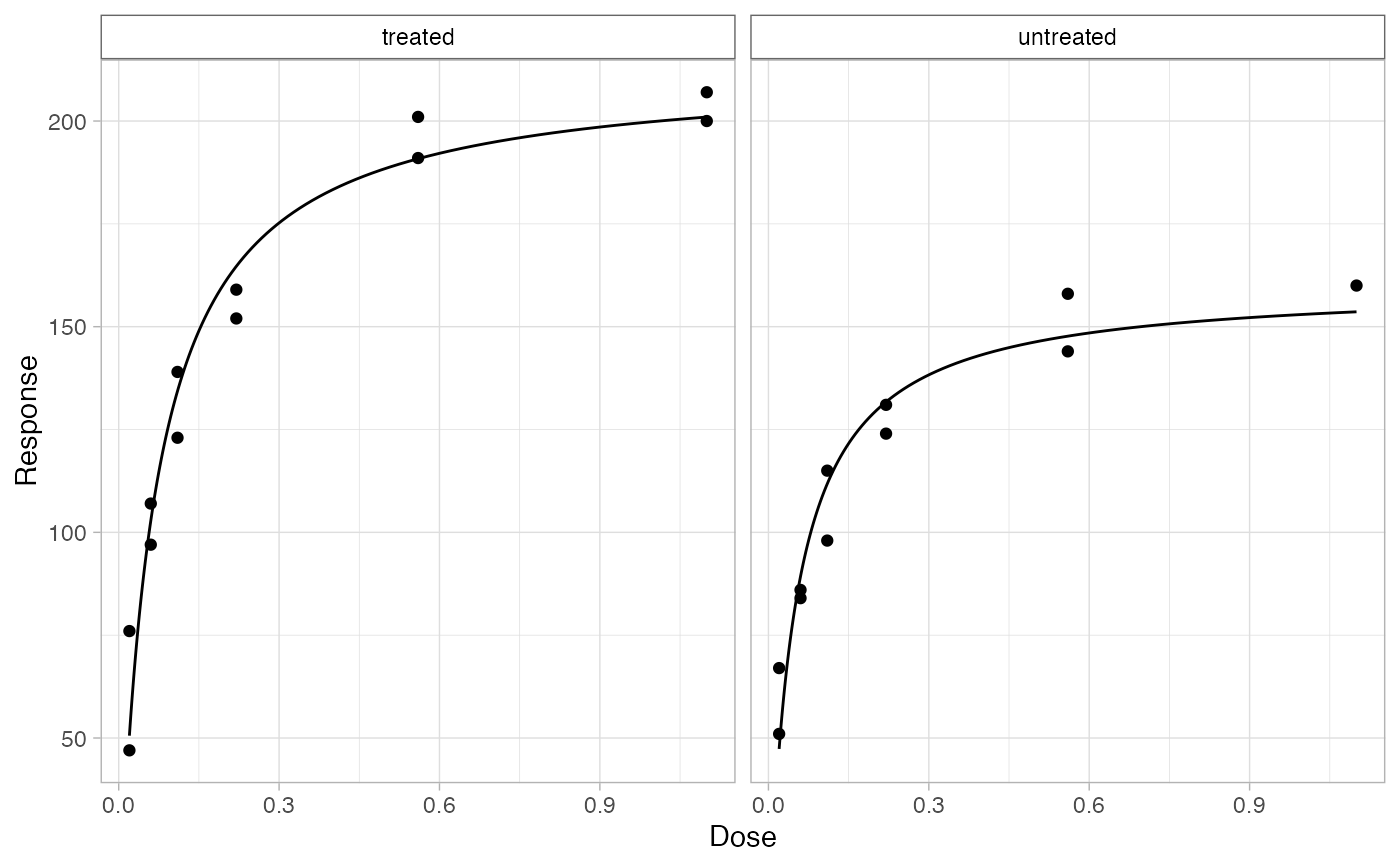
# quick plot can be made for inspecing the results with `bio_plot()`
df %>%
bio_plot()