The goal of biochemr is to create a user-friendly one-stop-shop interface to a range of R packages to help with reproducible analysis of common biochemistry experiments.
biochemr provides a common and consistent interface to a range of packages for analysis of results, following the tidyverse conventions to make most things easier, at the cost of making some niche things harder.
The documentation and tutorials that make up biochemr assume the user will have very little experience with R and programming in general - placing emphasis on newcomer friendly documentation over brevity.
Installation
And the development version from GitHub with:
# install.packages("devtools")
devtools::install_github("BradyAJohnston/biochemr")
Example
Analyze enzyme rate experiments by fitting the Michaelis
Menton equation that is implemented from the drc
package via drc::MM.2().
Experimetal Data
head(Puromycin)
#>   conc rate   state
#> 1 0.02   76 treated
#> 2 0.02   47 treated
#> 3 0.06   97 treated
#> 4 0.06  107 treated
#> 5 0.11  123 treated
#> 6 0.11  139 treated
library(biochemr)
df <- bio_enzyme_rate(Puromycin, conc, rate, state)

df
#> # A tibble: 2 × 6
#> # Groups:   state [2]
#>   state     raw               data              drmod  line           coefs
#>   <fct>     <list>            <list>            <list> <list>         <list>
#> 1 treated   <tibble [12 × 2]> <tibble [12 × 5]> <drc>  <df [230 × 4]> <tibble […
#> 2 untreated <tibble [11 × 2]> <tibble [11 × 5]> <drc>  <df [230 × 4]> <tibble […
The result is a tibble (like a data.frame) that has a row for each
sample and a column the relevant data for each. The original data is in
raw, the dose, response and residuals are in
data, the fitted model is inside drmod and the
fitted curve (to draw the line) in line and the
coefficients (such as Vmax and Km) in
coefs.
To extract relevant coefficients, use bio_coefs().
df %>%
  bio_coefs()
#> # A tibble: 4 × 7
#> # Groups:   state [2]
#>   state     term  curve       estimate std.error statistic  p.value
#>   <fct>     <chr> <chr>          <dbl>     <dbl>     <dbl>    <dbl>
#> 1 treated   Vmax  (Intercept) 213.       7.16        29.7  4.37e-11
#> 2 treated   Km    (Intercept)   0.0641   0.00871      7.36 2.42e- 5
#> 3 untreated Vmax  (Intercept) 160.       6.81        23.5  2.14e- 9
#> 4 untreated Km    (Intercept)   0.0477   0.00842      5.67 3.07e- 4
Plotting
Quick and convenient plotting for the results of different plotting functions.

The bio_plot() function just returns a
ggplot object, so you can continue customisation as you
would otherwise.
plt +
  ggplot2::labs(x = "[substrate] nM",
                y = "Enzyme Rate (nM/M/min)")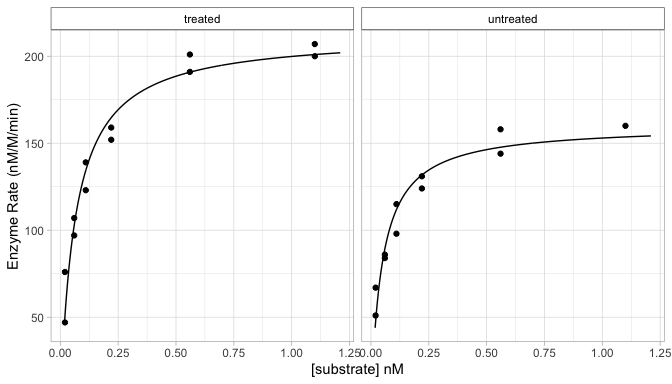
Roadmap
The plan is to add support for as many types of analysis for experiments in biochemistry as possible. A list of planned and currently supported approaches are below. Please open an issue or make a pull request to add analysis you would like to see supported.
Experimental analysis to be supported by biochemr:
-
Ligand binding experiments for calculating
Kd. -
Enzyme rate experiments for calculating
VmaxandKm - qPCR Experimental Analysis
- Replotting of FPLC / HPLC Traces for aesthetic and informative chromatograms.
- Creating and estimating unkowns from standard curves.