Plot Data with Fitted Models
bio_plot(
  data,
  ...,
  facet = TRUE,
  line_col = "black",
  line_type = "solid",
  line_size = 0.8,
  line_alpha = 1,
  point_shape = 21,
  point_col = "black",
  point_alpha = 1,
  point_size = 1
)
Arguments
- data
Tibble with nested columns of
data,drmod,line,coefsmade through one of thebio_binding()orbio_enzyme_*()functions.- ...
Additional
ggplot2::aes()parameters to be applied to the plot.- facet
Logical, whether to apply
ggplot2::facet_wrap()based on the- point_size
currently used facetting variables.
Value
ggplot2::ggplot() object.
Examples
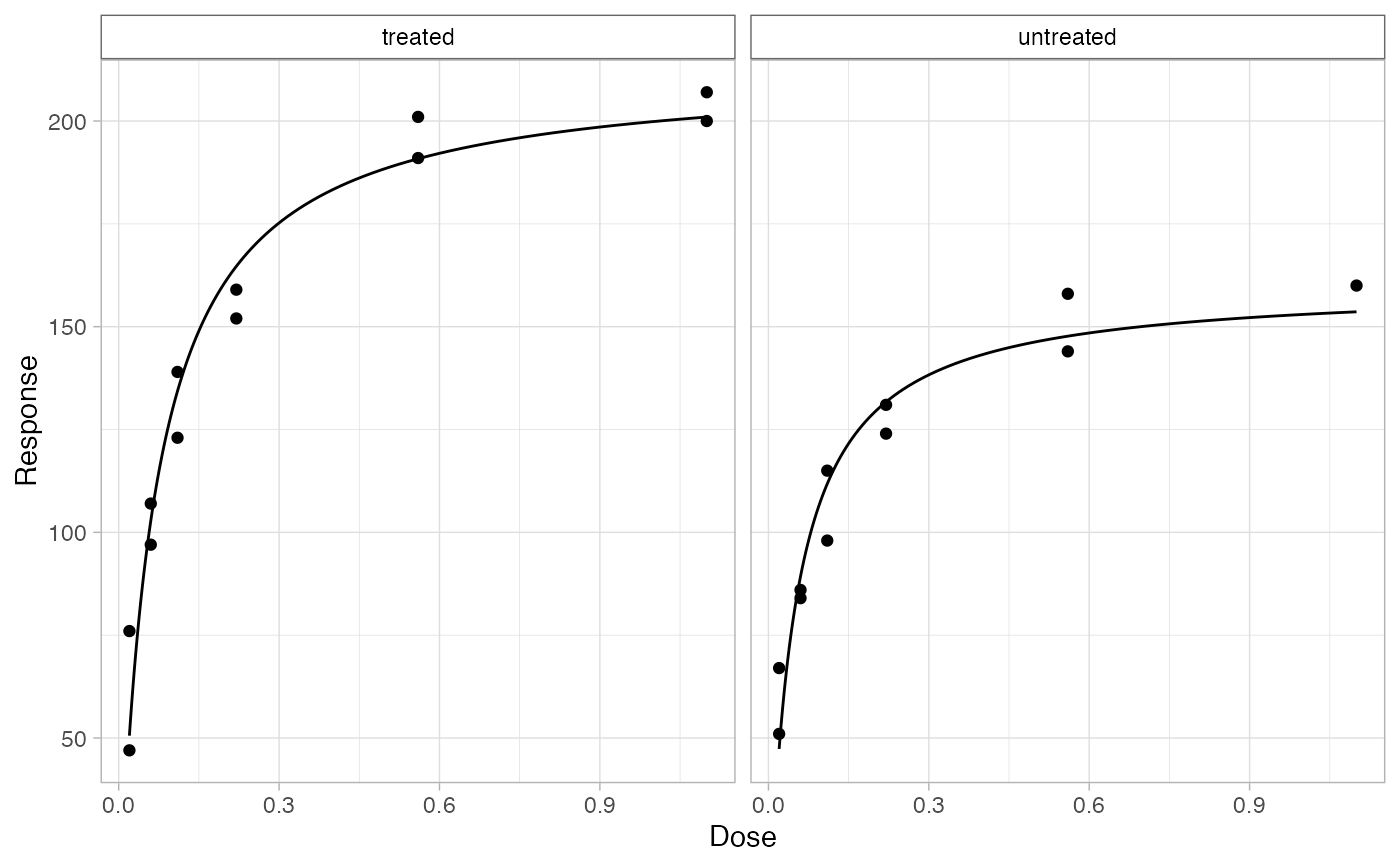
library(biochemr)
Puromycin %>%
  bio_enzyme_rate(conc, rate, group = state) %>%
  bio_plot()