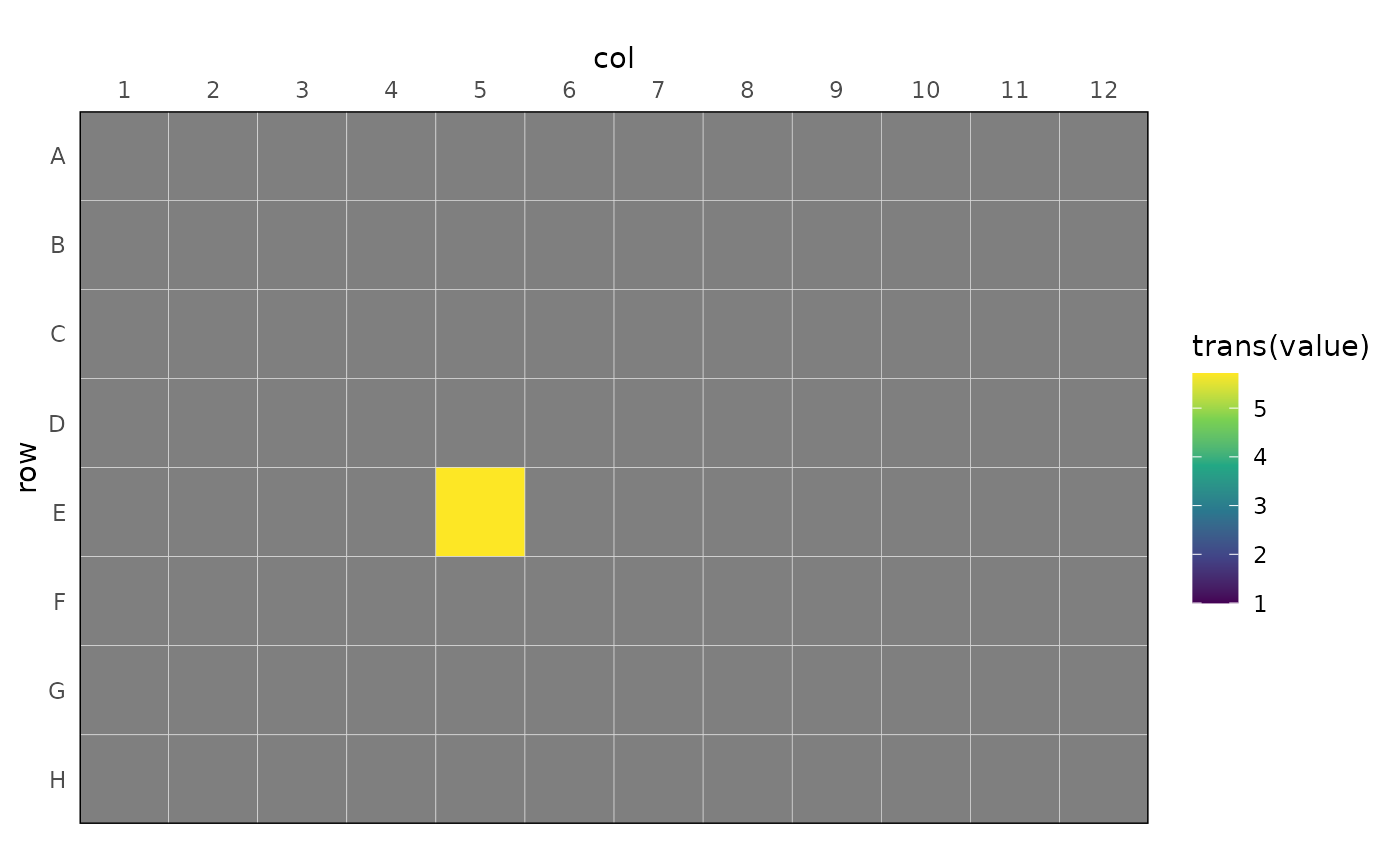
Plot a Plate-Layout of the Value Column
rl_plot_plate(data, value, well = "well", trans = log10)Arguments
- data
Dataframe with the value column and a column specifying the well ID.
- value
Name of the column containing the value information to be displayed.
- well
Name of the column with the well ID information for formatting the plate layout.
- trans
Name of the transformation to apply to the data. Defaults to
log10.
Value
a ggplot2::ggplot() plot.
Examples
fl <- system.file(
  "extdata",
  "calibrate_tecan",
  "calTecan1.xlsx",
  package = "reluxr"
)

dat <- plate_read_tecan(fl)

mat_d_best <- dat |>
  dplyr::filter(signal == "LUMI") |>
  dplyr::filter(time_s > 500) |>
  rl_calc_decon_matrix("value", "time_s", ref_well = "E05", b_noise = 30)

dat |>
  dplyr::filter(signal == "LUMI") |>
  dplyr::filter(time_s > 500) |>
  rl_adjust_plate(value, mat_d_best, time = time_s) |>
  dplyr::summarise(value = mean(value), .by = well) |>
  rl_plot_plate(value, trans = log10) +
  ggplot2::scale_fill_viridis_c(
    limits = c(1, NA)
  )
#> Scale for fill is already present.
#> Adding another scale for fill, which will replace the existing scale.
#> Warning: NaNs produced
