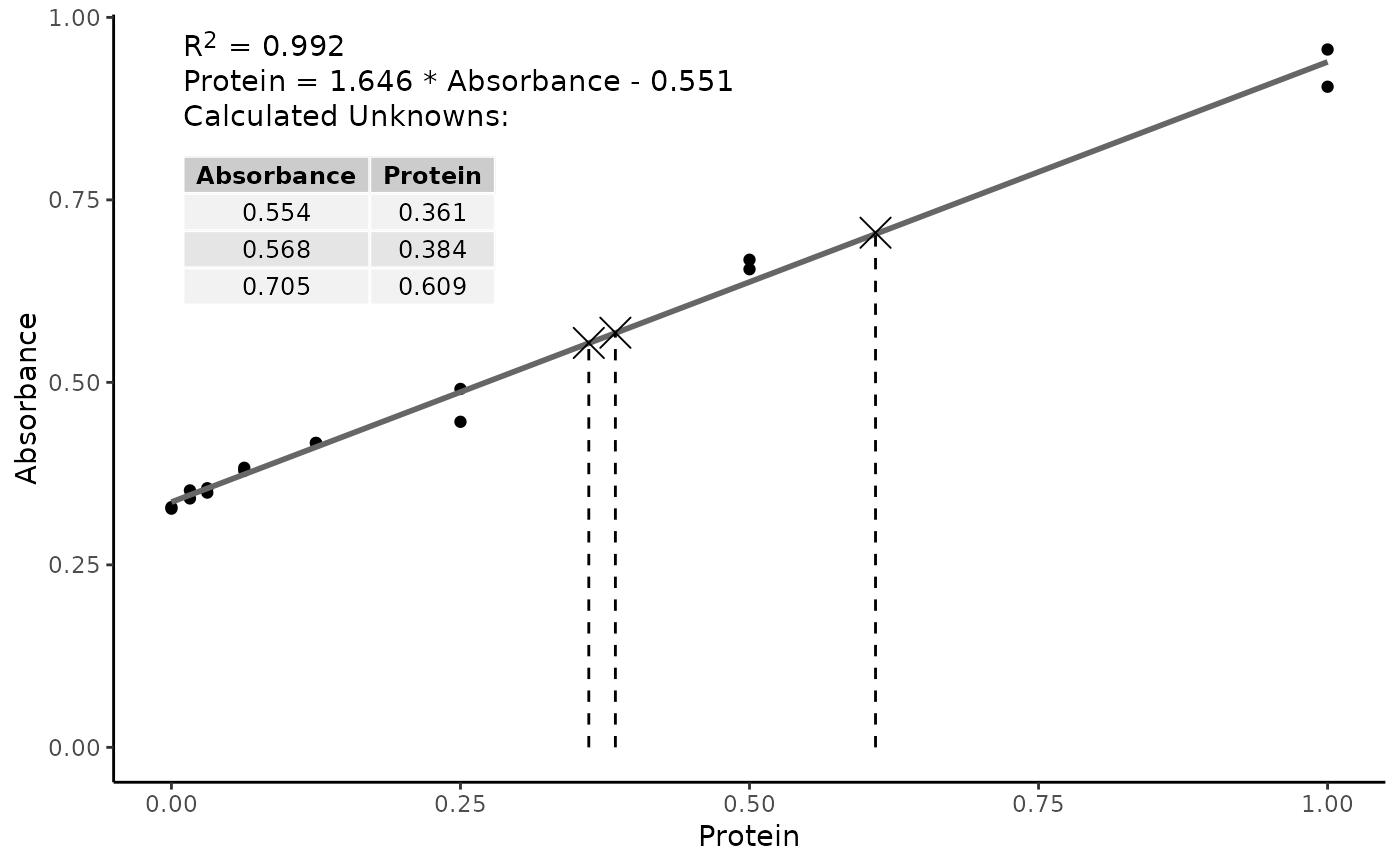
Plot a Standard Curve
std_curve_plot(data)Arguments
- data
Result of
std_curve_pred()orstd_curve_fit().
Value
a ggplot2 plot with the standard curve and unkowns
plotted, whch can be further customised using ggplot options.
Examples
library(standard)

# Protein concentrations of the standards used in the assay
prot <- c(
  0.000, 0.016, 0.031, 0.063, 0.125, 0.250, 0.500, 1.000,
  0.000, 0.016, 0.031, 0.063, 0.125, 0.250, 0.500, 1.000
)

# absorbance readins from the standards used in the assay
abs <- c(
  0.329, 0.352, 0.349, 0.379, 0.417, 0.491, 0.668, 0.956,
  0.327, 0.341, 0.355, 0.383, 0.417, 0.446, 0.655, 0.905
)
assay_data <- data.frame(
  Protein = prot,
  Absorbance = abs
)

# unknown concentrations
unk <- c(0.554, 0.568, 0.705)


assay_data |>
  std_curve_fit(Protein, Absorbance) |>
  std_curve_calc(unk) |>
  plot()